
Figures & data
Table 1 Domains and Items Addressed in the Questionnaire
Figure 1 Description of study participants. (a) Distribution of participants according to years after finishing residency. (b) Distribution of participants according to the workplace. (c) Subspecialties of the participants.
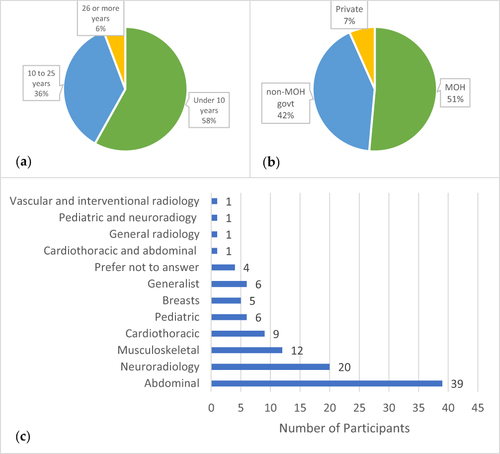
Figure 2 Description of provided teleradiology services. (a) Percentage of teleradiology images interpreted by the participants out of their annual interpretation volume. (b) Types of teleradiology images interpreted by the participants. (c) Source of teleradiology images interpreted by the participants. (d) Coverage hours for teleradiology services by the participants.
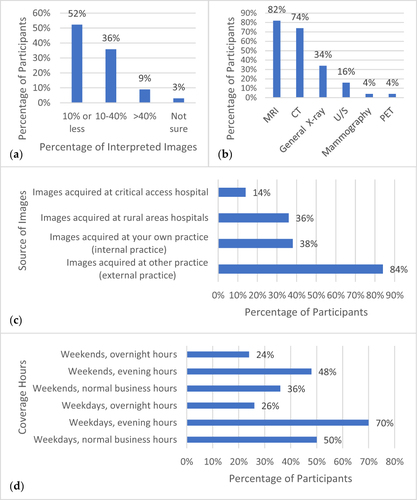
Table 2 Percentage of Participants Who Indicated a Given Characteristic as Somewhat Challenging or Extremely Challenging
Table 3 Percentage of Participants Who Indicated a Given Strategy Somewhat Useful or Extremely Useful
Table 4 Percentage of Participants Who Indicated Agree or Strongly Agree to the Stated Potential Benefits of Teleradiology