
Figures & data
Table 1 Sociodemographic Characteristics and the Distribution of IPV, Work Thriving and Work Alienation (n = 478)
Table 2 Correlation Between Variables in the Study
Table 3 Summary of Total, Direct and Indirect Effects of Four Mediation Model
Figure 1 Mediation model of Resilience in the relationship between IPV victimization and work thriving/work alienation.
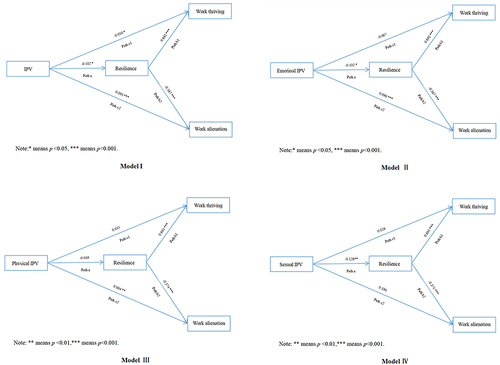
Table 4 Goodness-of-Fit of Hypothesized Structural Model
Data Sharing Statement
All data generated or analysed during this study are included in this article. Further enquiries can be directed to the corresponding author.