Figures & data
Table 1 Variable Description
Table 2 Correlation Analysis Between Variables
Table 3 Moderating Effect of Health Lifestyle on the Relationship Between the Number of NCDs and HRQoL
Figure 1 Simple slope plot of the interaction between the number of NCDs and health lifestyle on HRQoL.
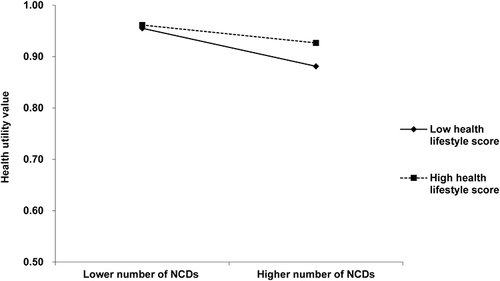
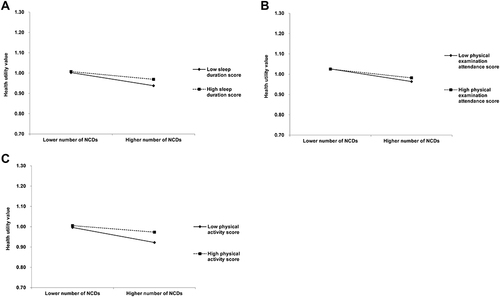
Table 4 Moderating Effect of Each Health-Related Behaviors on the Relationship Between the Number of NCDs and HRQoL
Figure 2 Simple slope plot of the interactions between the number of NCDs and health-related behaviors on HRQoL. (A) The moderating effect of sleep duration on the relationship between the number of NCDs and HRQoL. (B) The moderating effect of physical examination attendance on the relationship between the number of NCDs and HRQoL. (C) The moderating effect of physical activity on the relationship between the number of NCDs and HRQoL.