Figures & data
Table 1 The Demographic Data for the Enrolled Participants (n = 179)
Figure 1 Flowchart of the participants.
Abbreviations: CRC, colorectal cancer; AA, advanced adenoma; HGIN, high-grade intraepithelial neoplasia; LGIN, low-grade intraepithelial neoplasia.
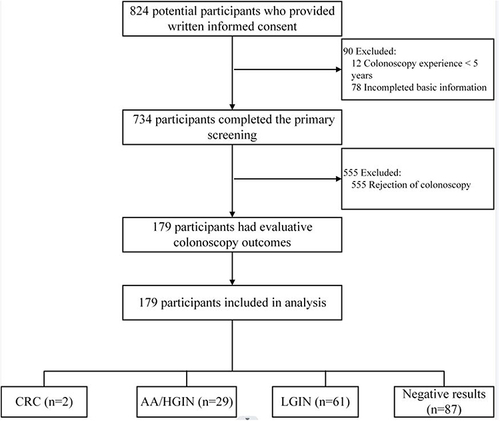
Table 2 Univariate and Multivariate Analysis of Predictors for Positive Colonoscopy Results in the Training Cohort
Figure 2 The nomograms for predicting positive colonoscopy results.
Abbreviations: APCS, Asia-Pacific colorectal screening; FIT, fecal immunochemical testing; sDNA, stool deoxyribonucleic acid.
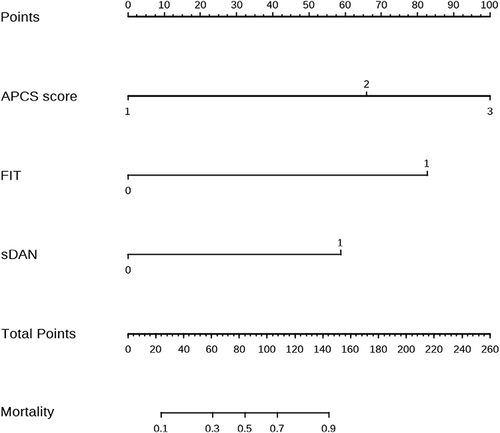
Figure 3 ROC curves of the established model in the training set (A) and validation set (B).
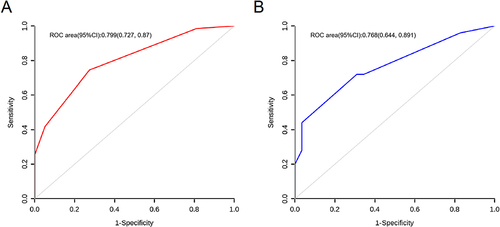
Figure 4 Calibration curve of the model in the validation set.
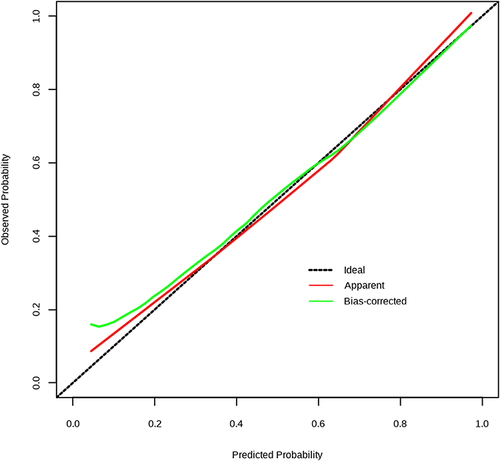
Figure 5 Decision curve analysis (DCA) for the predictive model. The net benefit was produced against the high-risk threshold.
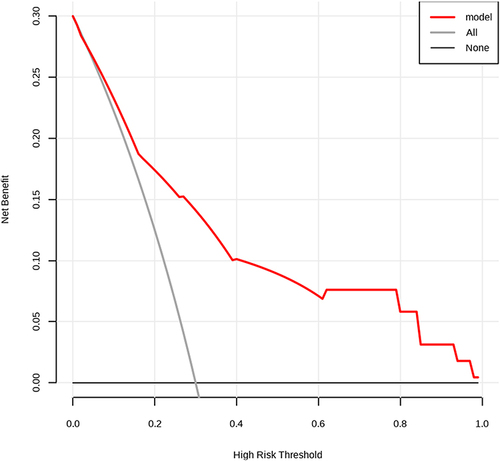
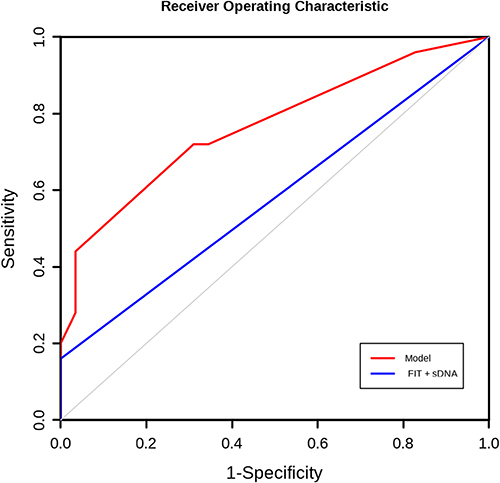
Figure 6 Comparison of ROC curves of the established model and FIT + sDNA.
Abbreviations: ROC, receiver operating characteristic; FIT, fecal immunochemical testing; sDNA, stool deoxyribonucleic acid.