
Figures & data
Figure 1 Flow chart of study participants.
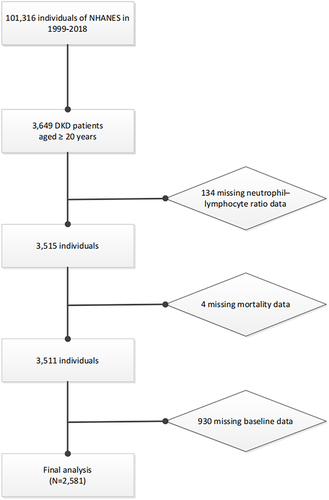
Table 1 Characteristic of Participants
Figure 2 (A) Depicts the distribution of lower and higher NLR and the cutoff point was determined by the maximally selected rank statistics (B).
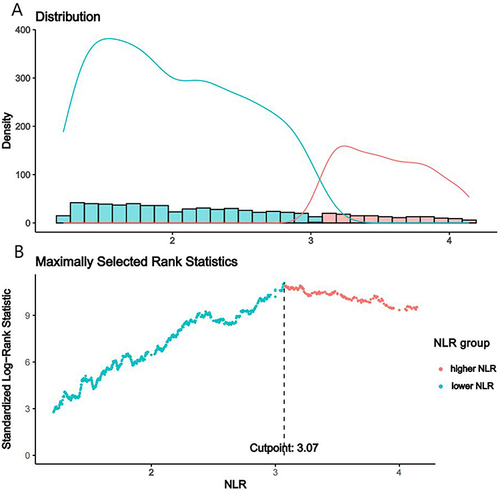
Table 2 The Relationships Between NLR and Mortality in DKD
Figure 3 Association between NLR and all-cause (A) and cardiovascular mortality (B) among DKD visualized by restricted cubic spline (NLR breakpoint: 3.07). Adjusted for age, sex, race, marital status, family income, education levels, BMI, HbA1c, Scr, BUN, TC, HDLC, UACR, eGFR, drinking status, smoking status, hypertension, CVD and anti-infective drugs. Both P value for nonlinearity > 0.05.
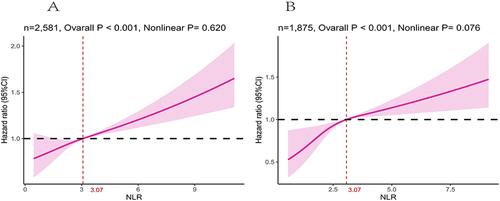
Figure 4 Kaplan–Meier analysis of the survival rate and the number (%) of at risk DKD patients with higher (>3.07) and lower (<3.07) NLR values. (A) All-cause mortality. (B) Cardiovascular mortality.
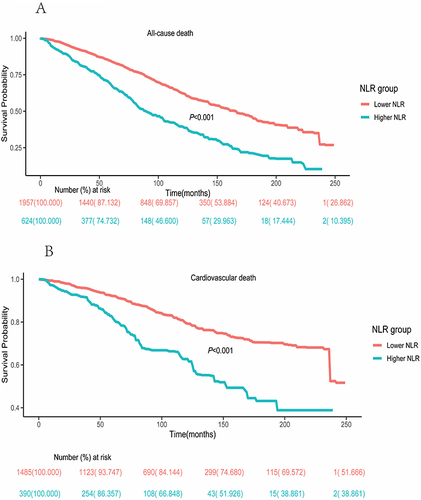
Figure 5 Subgroup analysis of the associations between NLR and mortality among DKD. Adjusted for age, sex, race, marital status, family income, education levels, BMI, HbA1c, Scr, BUN, TC, HDLC, UACR, eGFR, drinking status, smoking status, hypertension, CVD, and anti-infective drugs. (A) All-cause mortality. (B) Cardiovascular mortality.
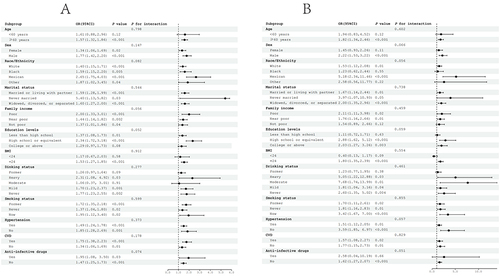
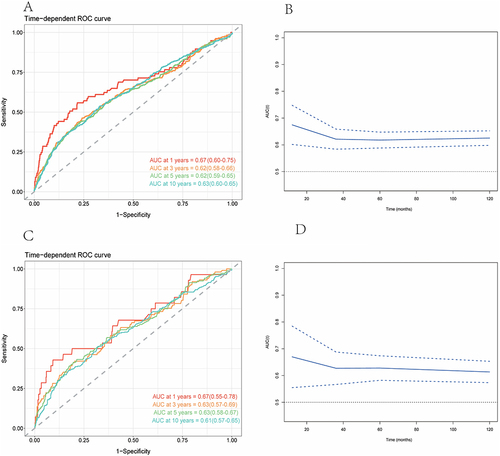
Figure 6 Time-dependent ROC curves and time-dependent AUC values of the NLR for predicting all-cause mortality (A and B) and cardiovascular mortality (C and D).
Data Sharing Statement
The National Health and Nutrition Examination Survey dataset is publicly available at the National Center for Health Statistics of the Centers for Disease Control and Prevention (https://www.cdc.gov/nchs/nhanes/index.htm).