Figures & data
Figure 1 Assessment of shoulder proprioception in (A) Flexion, (B) abduction, and (C) internal and external rotations.
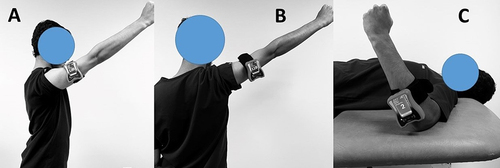
Table 1 Demographic Characteristics of Diabetes and Asymptomatic Population
Table 2 Comparison of Shoulder Joint Position Sense Between T2DM and Asymptomatic Groups
Table 3 The Relationship Between HbA1c Values and Shoulder Joint Position Errors in Patients with T2DM
Figure 2 Scatter plot showcasing the correlation between glycated hemoglobin (HbA1c) levels and shoulder joint position errors (JPE) in degrees for different movements in patients with Type 2 Diabetes Mellitus (T2DM). Each point indicates the correlation coefficient (r) for the specified shoulder movement. Statistically significant correlations are observed with p-values less than 0.001 across all movements.
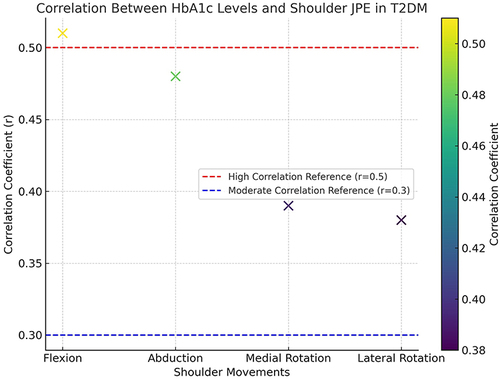
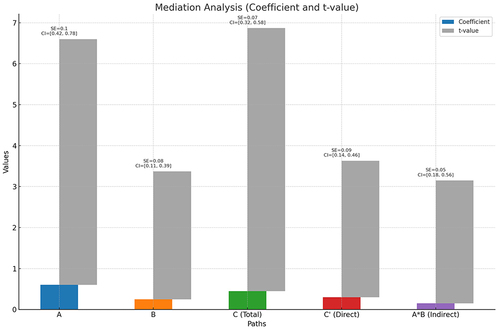
Table 4 Mediation Analysis of the Relationship Between HbA1c Levels, T2DM Status, and Shoulder Joint Position Sense
Figure 3 Comprehensive Mediation Analysis: Coefficients and t-Values for HbA1c, T2DM Status, and Shoulder JPS Relationship.