
Figures & data
Table 1 Descriptive Statistics and Analysis of Variance for All Variables (n=504)
Table 2 Model Fit Indices Derived from Latent Class Analysis on Models with 1–4 Classes
Figure 1 The three-class model and probability of 10 oral health symptoms within each class (n = 504).
Notes: This Figure was made by this group on 2 February 2024 using GraphPad Prism. Class 1, Low level group - oral health; Class 2, Moderate level group - oral health; Class 3, High level group - oral health. A1, Lymph nodes; A2, Lips; A3, Tongue; A4, Tissue inside cheek, floor, and roof of mouth; A5, Tissue inside cheek, floor, and roof of mouth; A6, Saliva and effect on tissue; A7, Condition of natural teeth; A8, Condition of artificial teeth; A9, Pairs of teeth in chewing position (natural or artificial); A10, Oral cleanliness.
Abbreviations: BMI, Body Mass Index; CRP, C-reactive protein; WBC, white blood cell count; BOHSE, Brief oral health status examination; OFI-8, Oral Frailty Index-8; MNA-SF, Mini-Nutritional Assessment Short Form; FSQ, Frailty Screening Questionnaire; AIC, Akaike information criterion; BIC, Bayesian information criterion; aBIC, adjusted BIC; LMR, Lo Mendell-Rubin; BLRT, Bootstrapped likelihood ratio test; C1, Low level group - oral health; C2, Moderate level group - oral health; C3, High level group - oral health.
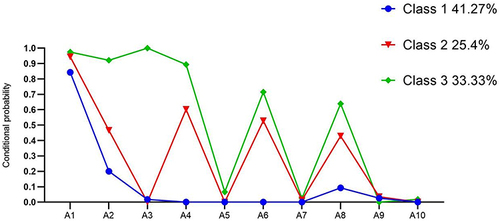
Table 3 Multiple Multinomial Logistic Regression for Latent Classes
Data Sharing Statement
The original contributions presented in the study are included in the article, further inquiries can be directed to the corresponding authors.