Figures & data
Figure 1 Number of annual publications in the sarcopenia and microbiota research field and the frequency of citations per year.
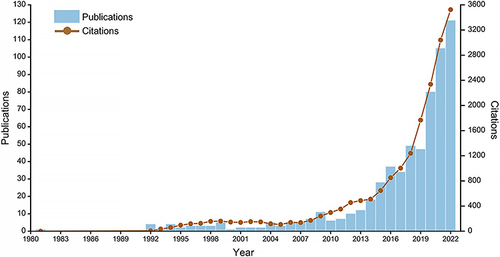
Table 1 The Top 10 Country in Terms of Number of Articles Published About Sarcopenia and Microbiota
Figure 2 Map visualization of publications and international collaboration network on sarcopenia and microbiota by countries/territories. (a): Map visualization of publications on sarcopenia and microbiota by countries/territories. (b): International collaboration network between countries. The size of each circle represents the number of publications in the country. The bigger the circle, the more the number of publications the country has contributed. The links between the circle signify the collaboration between every two countries.
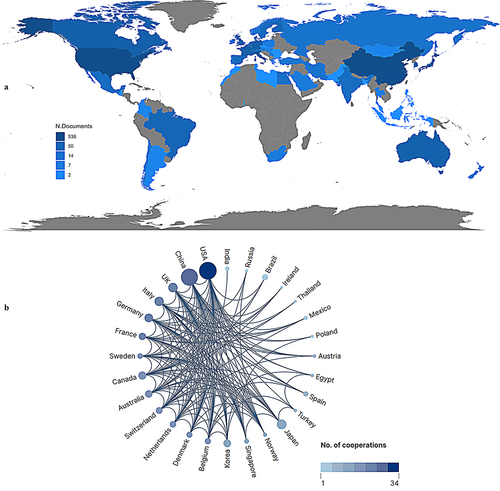
Figure 3 The top 20 subject categories regarding articles published about sarcopenia and microbiota.
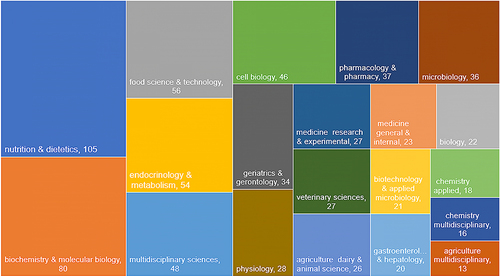
Figure 4 Total link strength networks of inter-institutional and authors’ contributions collaborations in sarcopenia and microbiota research. (a): Total link strength network of inter-institutional collaborations in sarcopenia and microbiota research. (b): Total link strength network of authors’ contributions collaborations in sarcopenia and microbiota research. Each node represents an institutional/author’s contributions determined in the Web of Science database. The size of each node represents the number of publications. The bigger the node, the more the number of publications in the research field. The link between the nodes represents a collaborative relationship. The thicker the link, the more cooperation strength between the nodes.
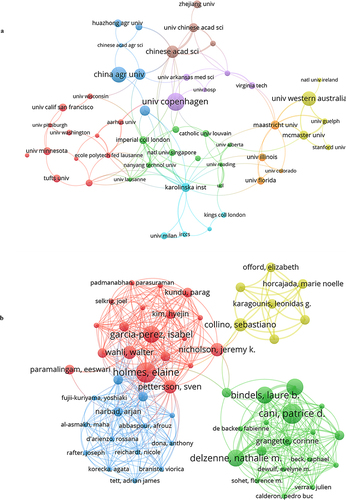
Table 2 The Top 10 Journals in Terms of Number of Articles Published About Sarcopenia and Microbiota
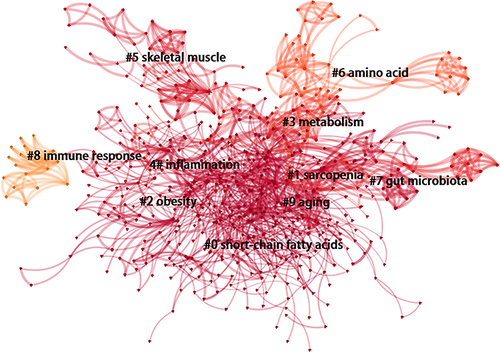
Figure 5 Keywords co-occurrence network of sarcopenia and microbiota research. The nodes are composed of tree rings that represent the frequency of the corresponding keyword over time. The links between the nodes represent the frequency of co-occurrence of the two corresponding keywords. The thicker the links, the more the frequency of the two keywords occurring together. The color of the links represented the corresponding time slices. The darker the color of the links was, the newer the keywords occurred in the publications.
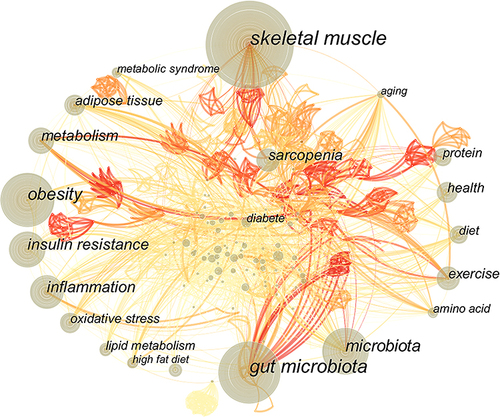
Figure 6 Top 25 keywords with the strongest citation bursts. The figure shows the strength of the keyword citation bursts. The higher the value, the greater the strength, and the higher the research heat of the keyword in the period. The red represents the time of the keyword citation bursts, and the red length represents the duration of the research heat of the keyword.
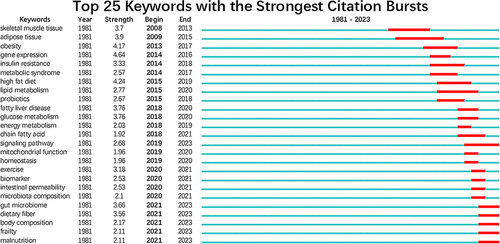
Table 3 Cluster Analysis of Keywords
Figure 7 Top 10 keywords cluster map. Each node represents a data point, and the lines between nodes indicate how similar they are.