
Figures & data
Figure 1 Flowchart illustrating the selection process for studies included in the systematic review.
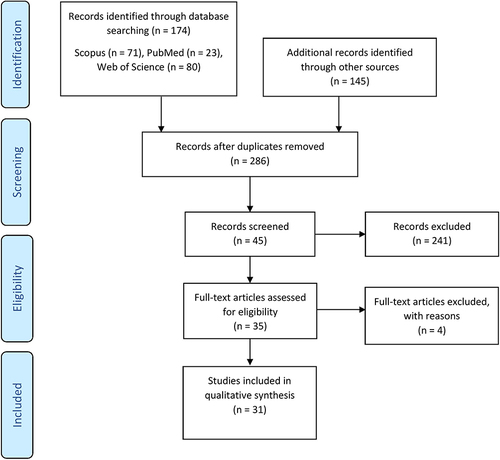
Table 1 Characteristics of Selected Studies Included in the Systematic Review (n = 31)
Table 2 Risk of Assessment Bias for Selected Studies Included in the Systematic Review (n = 31)
Table 3 Anthropometric Assessment Reported in Selected Studies Included in the Systematic Review (n = 15)
Table 4 Laboratory Results Reported in the Selected Studies That Included in the Systematic Review (n = 12)
Table 5 Dietary Intake Results Reported in the Selected Studies Included in the Systematic Review (n = 4)
Table 6 Types of Collected Data Related to Dietary Behavior Included in the Systematic Review (n = 10)