152
Views
9
CrossRef citations to date
0
Altmetric
Original Research

Sensory impairments in community health care: a descriptive study of hearing and vision among elderly Norwegians living at home

, , , &
Pages 217-225 | Published online: 28 May 2014

Figures & data

Table 1 Instruments and measured variables

Figure 1 Measured pure-tone average and self-assessment of the hearing function, measured in percentage.

Figure 1 Measured pure-tone average and self-assessment of the hearing function, measured in percentage.

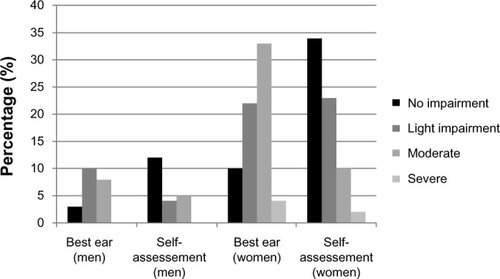
Table 2 Distribution of the measured pure-tone average

Figure 2 Measured visual acuity and the self-assessment of the visual function, measured in percentage.

Figure 2 Measured visual acuity and the self-assessment of the visual function, measured in percentage.

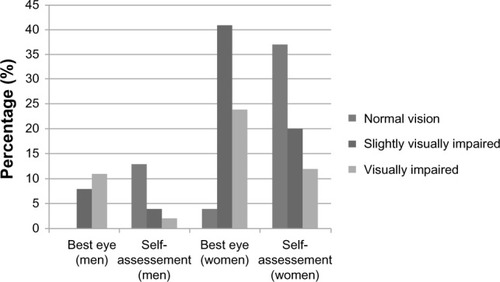
Table 3 Distribution of measured visual acuity

Table 4 Self-assessed ability to communicate and read from the KAS-Screen, % (n)