
Figures & data
Figure 1 Flow chart showing the samples at T1 and T2.
Abbreviations: IG, intervention group; CG, control group; T1, test 1; T2, test 2.
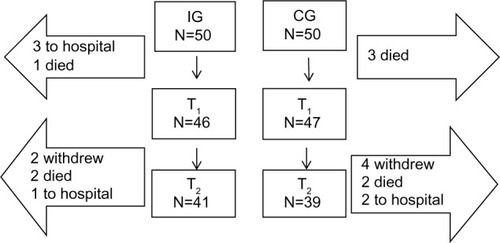
Table 1 Instruments and measured variables
Table 2 Sociodemographics at T1
Table 3 Measured lighting levels (lux) at T1 and T2
Table 4 Results from the KAS screen