
Figures & data
Figure 1 This figure presents a typical body map, with the location of pain sites ordered by importance (not always pain severity) according to the patients, from A to E, pain frequency and intensity in the visual analog scale (VAS).
Notes: Patients with human T-lymphotropic virus 1 often present with pain complaints in the lower back and lower limbs. The figure shows also the frequency of its distribution and the average reported intensity described using a VAS, where 0 indicates no pain and 10 the most intense pain (Mendes et alCitation22). Note that the pain tends to be more severe and frequent in the lower back. In the lower limbs it follows many distinct patterns, including a longitudinal distribution, which may be related to neuropathic or musculoskeletal pain, as well as joint pain.
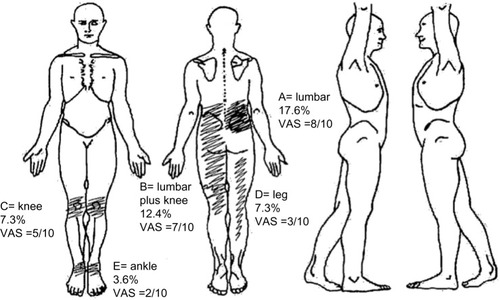
Table 1 Physiotherapeutic assessment and treatment of individuals with human T-lymphotropic virus 1 (HTLV-1)