
Figures & data
Table 1 Participant demographics (n=52)
Table 2 The internal consistency of Information Technology Attitude Scales for Health subscales of efficiency of care (A); education, training, and development (B); and the control scale (C)
Figure 1 The percentage of participants with different information and communication technology devices.
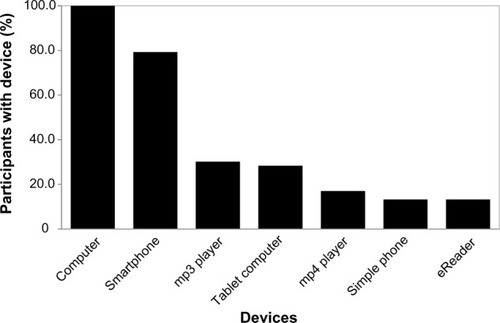
Table 3 The change in Information Technology Attitude Scales for Health subscales and self-reported overall confidence scores during the online subject
Table 4 Correlations between the amount of time spent engaged with ICT devices and Information Technology Attitude Scales for Health subscales and self-reported overall confidence at baseline