
Figures & data
Figure 1 Scheme of the study.
Abbreviation: SAMe, S-adenosyl-methionine.
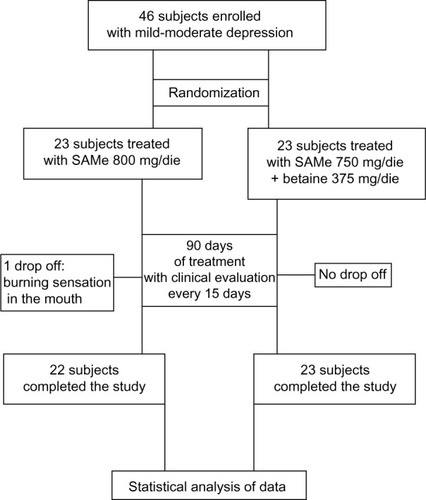
Figure 2 Score percentage variation versus T=0 in subjects treated with S-adenosyl-methionine (SAMe).
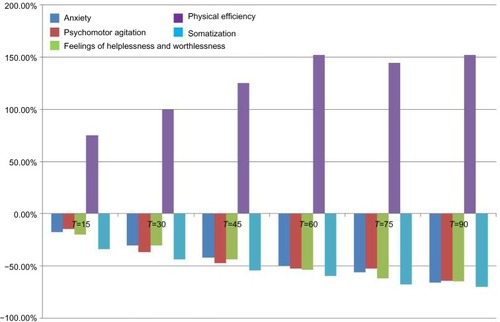
Figure 3 Score percentage variation versus T=0 in subjects treated with S-adenosyl-methionine (SAMe)/betaine.
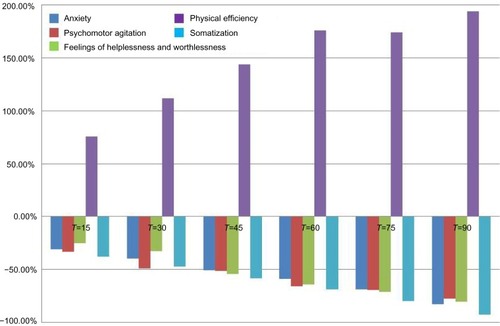
Table 1 Features of participants on enrolment
Table 2 Evaluation of the parameter “anxiety”
Table 3 Evaluation of the parameter “psychomotor agitation”
Table 4 Evaluation of the parameter “feelings of helplessness and worthlessness”
Table 5 Evaluation of the parameter “physical efficiency”
Table 6 Evaluation of the parameter “somatization”
Table 7 Tolerability assessment
Table 8 Compliance assessment