Figures & data
Table 1 Definition of symptomatology
Table 2 The baseline characteristics in LI patients with TSI and PSI
Table 3 Multivariate analysis of the association of the early predictors for LI patients with TSI and PSI
Figure 1 Kaplan–Meier survival curves for patients with TSI and PSI.
Abbreviations: LI, lacunar infarction; PSI, persistent symptoms with LI; TSI, transient symptoms with LI.
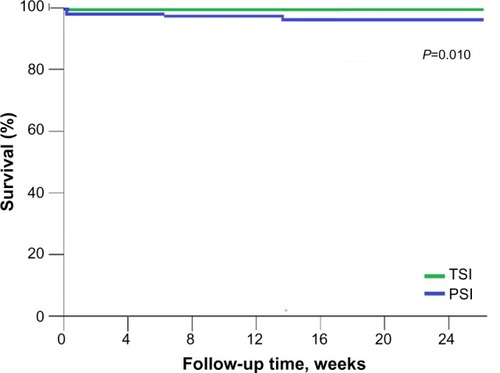
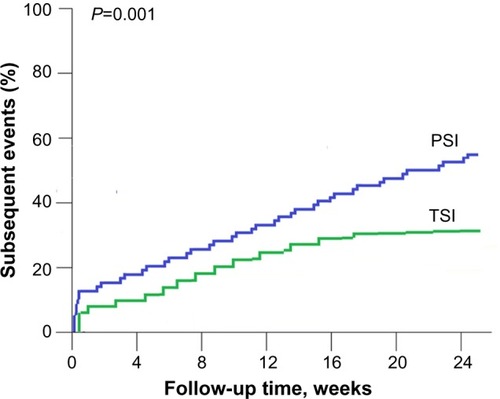
Figure 2 Kaplan–Meier subsequent events curves for patients with TSI and PSI.
Abbreviations: LI, lacunar infarction; PSI, persistent symptoms with LI; TSI, transient symptoms with LI.