
Figures & data
Figure 1 Selection of respondents for the analysis.
Abbreviations: CLBP, chronic low back pain; LBP, low back pain; NHWS, National Health and Wellness Survey.
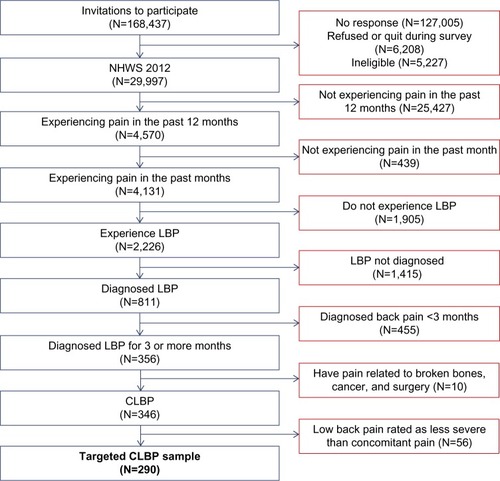
Table 1 Sociodemographic and health characteristics
Table 2 Pain characteristics
Table 3 Spearman correlation coefficients between pain in the past week and outcomes
Table 4 Regression-adjusted outcomes according to the level of pain in the past week