Figures & data
Table 1 Baseline demographic and clinical characteristics of patients
Figure 1 Change in average NRS over time by clinical entity.
Abbreviations: CPSP, chronic postsurgery pain; CRPS, complex regional pain syndrome; DPN, diabetic polyneuropathy; NES, nerve entrapment syndrome; NRS, numeric rating scale; PHN, postherpetic neuropathy
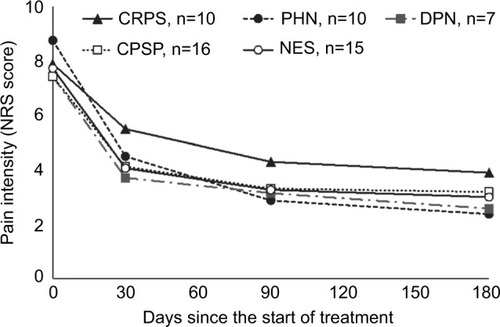
Table 2 Treatment outcomes for the overall sample and by clinical entity
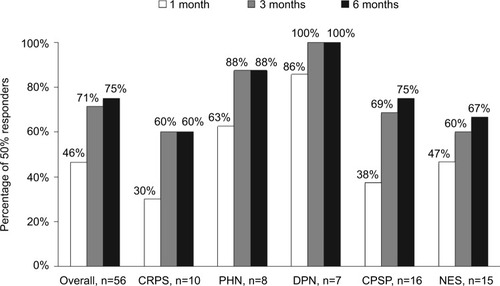
Figure 2 The percentage of patients reporting at least 50% pain intensity reduction, as measured by NRS score, after 1 month, 3 months, and 6 months of treatment.
Abbreviations: CPSP, chronic postsurgery pain; CRPS, complex regional pain syndrome; DPN, diabetic polyneuropathy; NES, nerve entrapment syndrome; NRS, numeric rating scale; PHN, postherpetic neuropathy.