Figures & data
Figure 1 Expression of ATF3-LI in TGs 2 weeks after partial ION transection.
Notes: (A) ATF3-LI is mainly seen in the infraorbital neurons (red box) in ipsilateral TGs. (B and C) High magnification micrographs show the expression of ATF3-IR neurons in ipsilateral (B) and contralateral (C) TGs. Scale bars indicate 250 μm (A) and 50 μm (B and C).
Abbreviations: ATF3, activating transcription factor 3; ION, infraorbital nerve; IR, immunoreactive; LI, like immunoreactivity; TGs, trigeminal ganglia.
Abbreviations: ATF3, activating transcription factor 3; ION, infraorbital nerve; IR, immunoreactive; LI, like immunoreactivity; TGs, trigeminal ganglia.
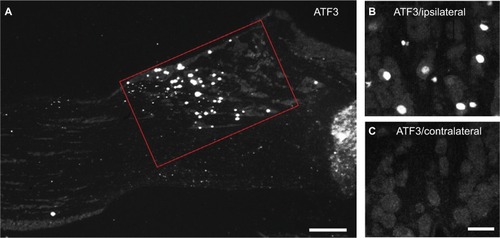
Figure 2 Percentage of positive NPs in contralateral and ipsilateral TGs 2 weeks after partial ION transection.
Note: The columns represent contralateral (blue) and ipsilateral (red) TGs, respectively (n=5 in each group, **p<0.01, ***p<0.001).
Abbreviations: ATF3, activating transcription factor 3; CGRP, calcitonin gene-related peptide; GAL, galanin; ION, infraorbital nerve; nNOS, neuronal nitric oxide synthase; NPs, neuronal profiles; NPY, neuropeptide Y; pAKT, phosphorylated AKT; SP, substance P; TGs, trigeminal ganglia.
Abbreviations: ATF3, activating transcription factor 3; CGRP, calcitonin gene-related peptide; GAL, galanin; ION, infraorbital nerve; nNOS, neuronal nitric oxide synthase; NPs, neuronal profiles; NPY, neuropeptide Y; pAKT, phosphorylated AKT; SP, substance P; TGs, trigeminal ganglia.
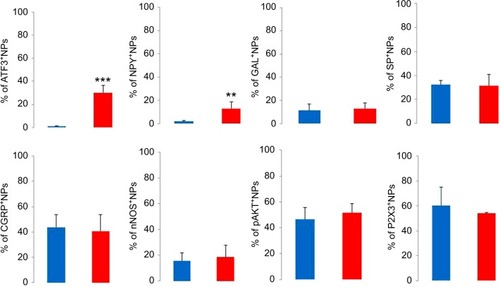
Figure 3 Immunofluorescent micrographs show the expression of biomarkers in contralateral (top panel) and ipsilateral (bottom panel) TGs 2 weeks after partial ION transection.
Notes: Sections were incubated with antisera of Iba1, CGRP, SP, GAL, NPY, P2X3, nNOS, and pAKT, respectively. Scale bar indicates 100 μm.
Abbreviations: CGRP, calcitonin gene-related peptide; ION, infraorbital nerve; nNOS, neuronal nitric oxide synthase; NPY, neuropeptide Y; pAKT, phosphorylated AKT; SP, substance P; TGs, trigeminal ganglia.
Abbreviations: CGRP, calcitonin gene-related peptide; ION, infraorbital nerve; nNOS, neuronal nitric oxide synthase; NPY, neuropeptide Y; pAKT, phosphorylated AKT; SP, substance P; TGs, trigeminal ganglia.
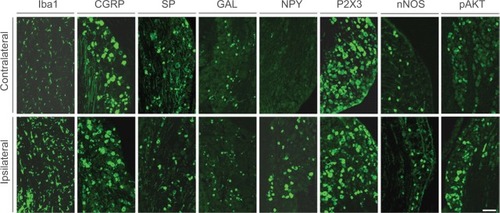
Figure 4 Expression of NPY and Iba1 in ipsilateral and contralateral TGs 2 weeks after partial ION transection.
Notes: NPY-LI is upregulated in ipsilateral TG (B) compared with the contralateral one (A). Immunofluorescence micrographs show a hypertrophic morphology of Iba1-LI in ipsilateral (D and F) vs. contralateral TGs (C and E), counterstaining with PI (red) (E and F). Arrows indicate the NPY-positive neurons (B) and Iba1-positive microglial cells (E and F), respectively. Scale bars indicate 50 μm (A and B), 30 μm (C and D), and 25 μm (E and F).
Abbreviations: ION, infraorbital nerve; LI, like immunoreactivity; NPY, neuropeptide Y; PI, propidium iodide; TGs, trigeminal ganglia.
Abbreviations: ION, infraorbital nerve; LI, like immunoreactivity; NPY, neuropeptide Y; PI, propidium iodide; TGs, trigeminal ganglia.
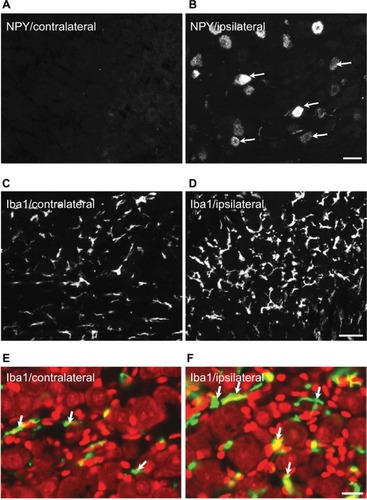
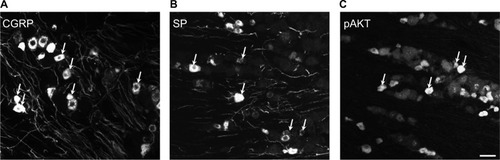
Figure 5 Immunofluorescent micrographs show the expression of biomarkers in contralateral TGs 2 weeks after partial ION transection.
Notes: CGRP-LI (A), SP-LI (B), and pAKT-LI (C) are present in the TG neurons. Arrows indicate positive neurons. Scale bar indicates 50 μm.
Abbreviations: CGRP, calcitonin gene-related peptide; ION, infraorbital nerve; LI, like immunoreactivity; SP, substance P; TGs, trigeminal ganglia; pAKT, phosphorylated AKT.
Abbreviations: CGRP, calcitonin gene-related peptide; ION, infraorbital nerve; LI, like immunoreactivity; SP, substance P; TGs, trigeminal ganglia; pAKT, phosphorylated AKT.