
Figures & data
Figure 1 Photographs of the experimental setup.
Notes: A mirror was placed between the participant’s right and left arms. The photographs depict the four study conditions: congruence (A), incongruence (B), intention (C), and proprioception (D).
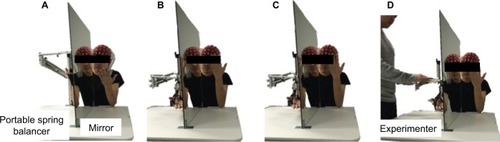
Figure 2 A bar chart showing the degree of dysesthesia detected under the four conditions.
Notes: Bars (mean [standard deviation]) represent the NRS scores for dysesthesia symptoms under the four conditions. The mean NRS scores for peculiarity and nausea were significantly higher under the incongruence, intention, and proprioception conditions than under the congruence condition.
Abbreviation: NRS, numeric rating scale.
Abbreviation: NRS, numeric rating scale.
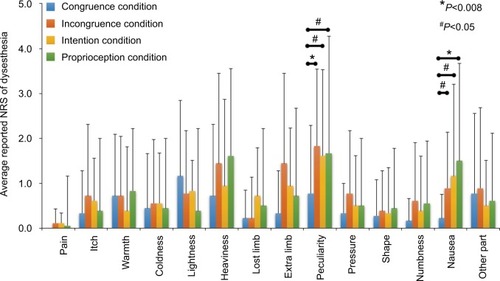
Figure 3 Correlation analysis of NRS scores for peculiarity (A and B) and nausea (C and D) with each condition.
Notes: NRS scores for peculiarity under the incongruence condition were significantly correlated with scores under the intention and proprioception conditions (A and B). In addition, a significant positive correlation was found between NRS scores for nausea under the incongruence and intention conditions (C) and under the incongruence and proprioception conditions (D).
Abbreviation: NRS, numeric rating scale.
Abbreviation: NRS, numeric rating scale.
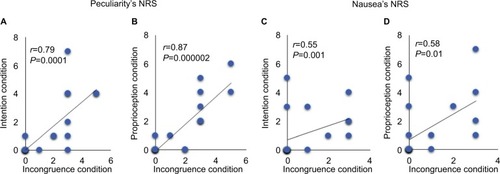
Figure 4 Topographic maps of ERD/ERS% of the high-frequency alpha rhythm band in the congruence (A), incongruence (B), intention (C), and proprioception (D) conditions.
Abbreviations: ERD, event-related desynchronization; ERS, event-related synchronization.
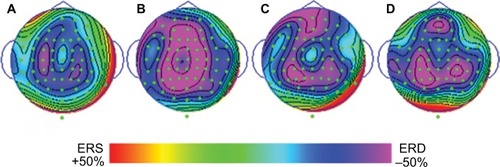
Figure 5 Correlation analysis of NRS scores for peculiarity and ERD/ERS% in the P8 channel (right inferior parietal region [A]) under the incongruence condition and the TP8 and P10 channels (right temporoparietal region [B and C]) under the proprioception condition.
Abbreviations: ERD, event-related desynchronization; ERS, event-related synchronization; NRS, numeric rating scale.
![Figure 5 Correlation analysis of NRS scores for peculiarity and ERD/ERS% in the P8 channel (right inferior parietal region [A]) under the incongruence condition and the TP8 and P10 channels (right temporoparietal region [B and C]) under the proprioception condition.](/cms/asset/a3d0b262-7b3f-4999-97b0-332c3c04a5fc/djpr_a_122564_f0005_c.jpg)