Figures & data
Table 1 Demographics, medications, and comorbidities of participants with AD
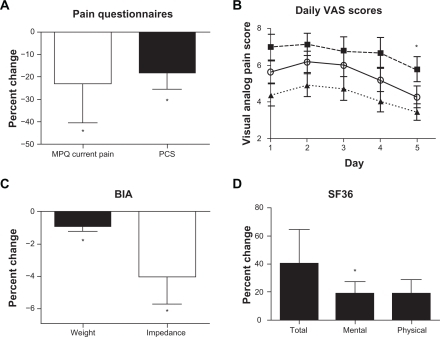
Figure 1 Change in pain questionnaire scores, weight, and bioimpedance before and after CVAC process exposures. A, MPQ (change in current pain) and PCS. B, Mean daily scores for average (open circles, unbroken line), highest (filled squares, dashed line), and lowest pain (filled triangle, dotted line) by the VAS. C, Change in percent weight and impedance from bioimpedance analysis. D, Percent change in total, mental, and physical SF-36 values.
*P < 0.05 comparing values from day 1 to day 5 by repeated measures ANOVA; actual P-values available in the text.
Abbreviations: CVAC, Cyclic Variations in Altitude Conditioning; MPQ, McGill pain questionnaire; PCS, pain catastrophizing Scale; VAS, visual analog scale; ANOVA, analysis of variance; BIA, bioelectrical impedance analysis.