
Figures & data
Figure 1 Model of sleep and somatization.
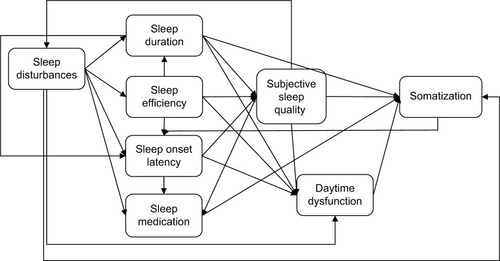
Table 1 Faculties of the CAU in percentage of the entire university and in the present sample
Table 5 Model fit of saturated and revised model of sleep and somatization
Table 2 Prevalence rates of FSS measured by the FFSS
Table 3 Prevalence rates of mental disorders measured by the PHQ
Table 4 Pearson product moment coefficients
Figure 2 Model of subjective sleep and somatization.
Note: Sex and age were included as control variables influencing somatization, sleep efficiency, sleep disturbances, and sleep duration. Path coefficients display standardized regression weights.
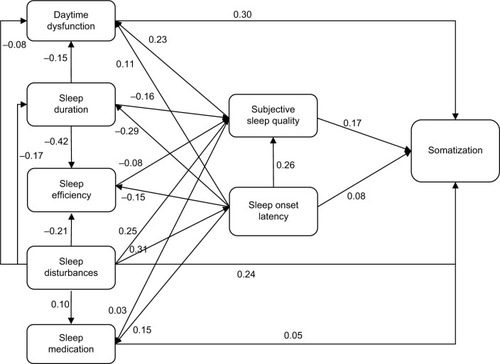
Figure 3 Sleep problems (PSQI), somatization (PHQ-15) in low, mean, and high depression (PHQ-9).
Abbreviations: PSQI, Pittsburgh Sleep Quality Index; PHQ, Patient Health Questionnaire – German Version.
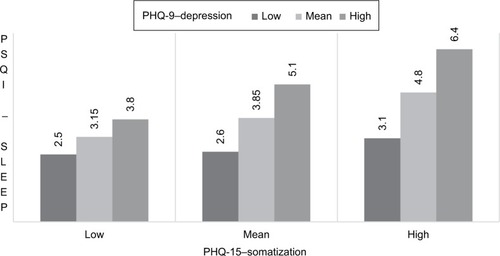
Figure 4 Model of somatization, sleep quality, depression, and anxiety.
Note: Path coefficients display standardized regression weights.
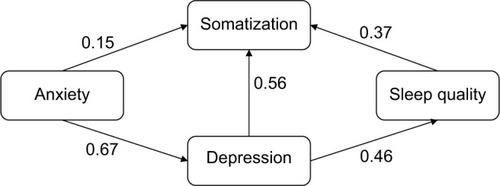
Table 6 Fit indices of the model on sleep quality, somatization, depression, and anxiety