
Figures & data
Table 1 Demographic characteristics of the study sample (n=24,925)
Figure 1 Study flowchart.
Abbreviation: NeP, neuropathic pain.
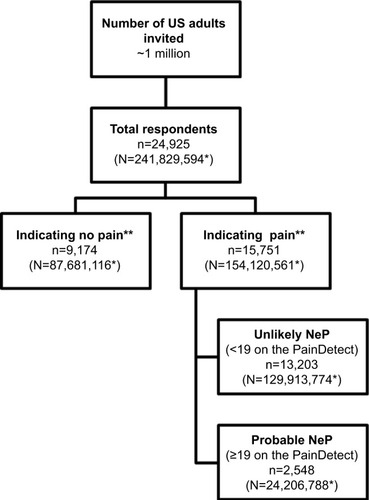
Figure 2 Distribution of PainDetect scores among those with pain (n=15,749).
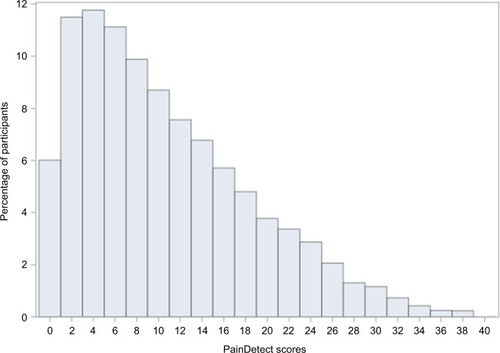
Figure 3 Heat map of the weighted prevalence of probable neuropathic pain, based on the PainDetect, among those with pain by demographic strata.
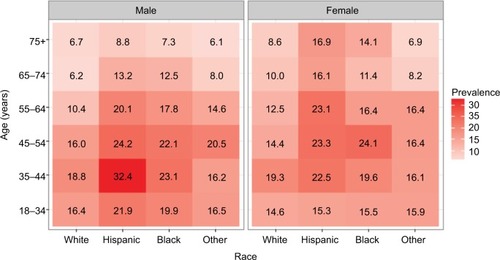
Table 2 Prevalence of NeP based on the PainDetect among all respondents and all respondents with pain by survey modality
Figure 4 Weighted comorbidity-prevalence estimates among respondents with probable NeP and respondents with pain but unlikely NeP.
Abbreviations: COPD, chronic obstructive pulmonary disease; GERD, gastroesophageal reflux disease; IBS, irritable bowel syndrome; MS, multiple sclerosis; NeP, neuropathic pain; RLS, restless leg syndrome; RA, rheumatoid arthritis; TIA, transient ischemic attack.
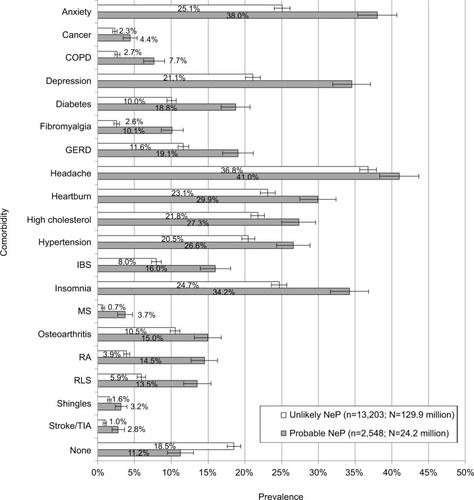
Table 3 Weighted demographic characteristics among respondents with probable NeP and respondents with pain but unlikely NeP
Figure 5 Weighted pain-type prevalence among respondents with probable NeP and respondents with pain but unlikely NeP.
Abbreviation: NeP, neuropathic pain.
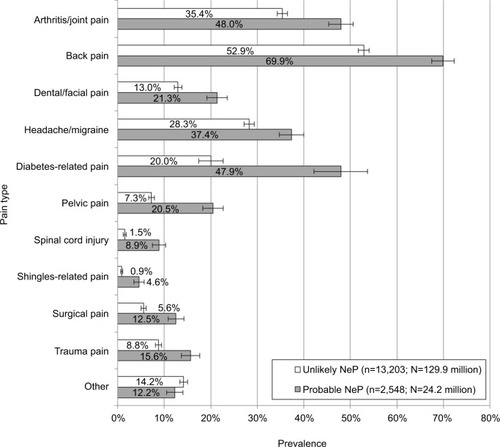
Table 4 Respondents’ duration of pain by pain type
Table 5 Current NeP-medication use by respondents who self-reported experiencing nerve pain for at least 3 months
Table S1 Medications participants reported for nerve pain, categorized by class