
Figures & data
Table 1 Demographic data at baseline (week 0)
Figure 1 Mean and SD pain intensity (11-point NRS) over time (observed-case analysis) at rest and on movement.
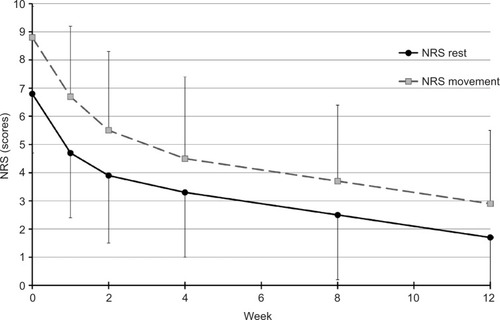
Figure 2 Percentage of patients with neuropathic pain 4 score ≥4 from baseline to week 12 (final evaluation).
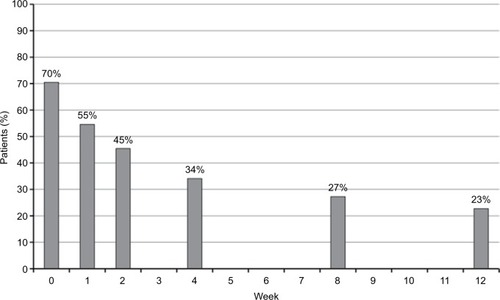
Figure 3 Neck Disability Index (NDI; mean and SD) from baseline to week 12 (final evaluation).
Abbreviation: SD, standard deviation.
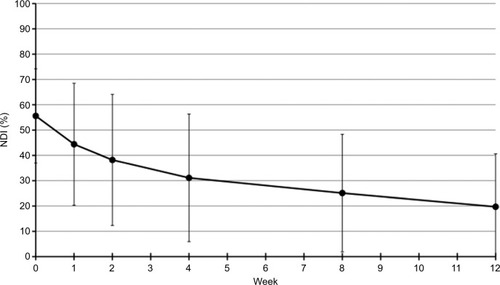
Figure 4 Percentage of neck ROM variation from baseline to week 12 (final evaluation).
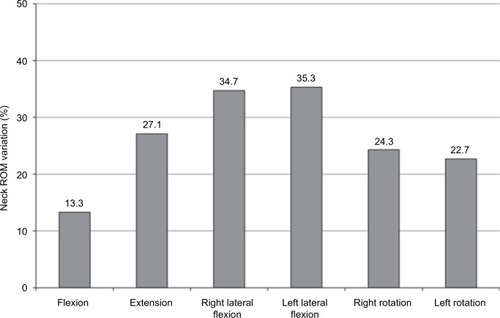
Figure 5 SF-36 physical and mental health and total score from baseline to week 12 (final evaluation).
Abbreviation: SF-36, Short Form (36) Health Survey.
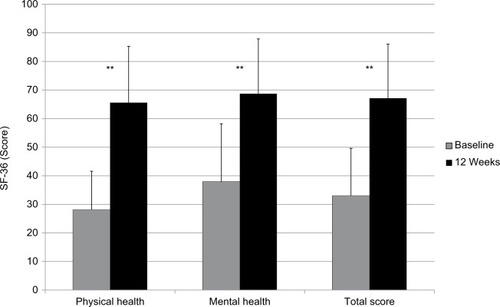
Figure 6 SF-36 scores from baseline to week 12 (final evaluation).
Abbreviation: SF-36, Short Form (36) Health Survey.
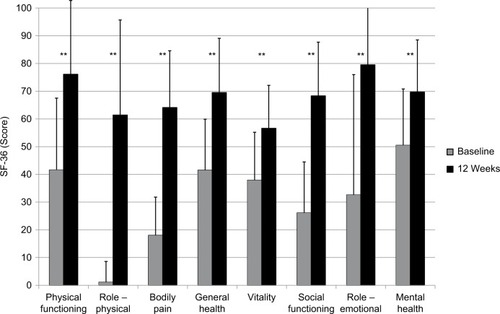
Table 2 Neck ROM at weeks 0 and 12
Table 3 Opioid-related symptoms at various time points
Table 4 Frequency of use (%) of other drugs at various time points