Figures & data
Figure 1 Flow chart of the study.
Abbreviations: TMG, traditional massage therapy group; SMG, experimental massage therapy group; T0, baseline; T1, end of the treatment program; T2, 3-month follow-up.
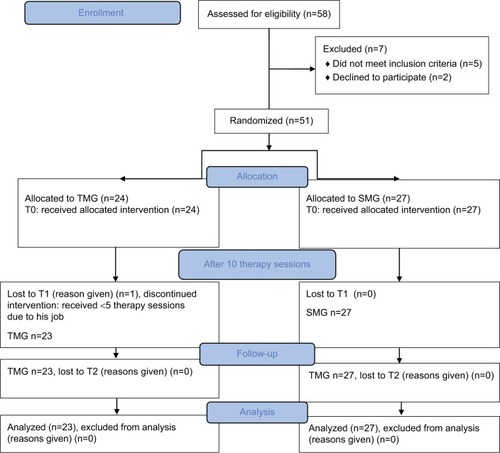
Figure 2 Traditional rehabilitative massage program.
Notes: Progression of the different phases: surface and deep touch (A), static and dynamic pressure (B), pinching and rolling (C).
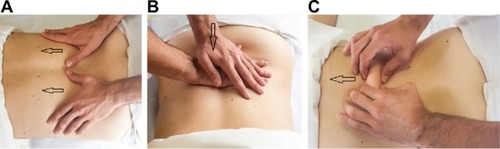
Figure 3 Preparatory phase to the massage.
Notes: (A) The pleasant “contact” in the area of the back without pain. (B) The physiotherapist touches the painful area on the back.
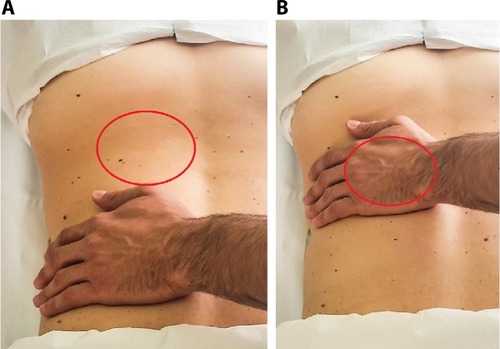
Table 1 Demographic and clinical data of participants at baseline
Table 2 Data and statistical analyses
Figure 4 VAS at T0, T1, and T2 for the two groups for Mann–Whitney U test.
Notes: The boxes show the lower quartile, median (middle line in box), and upper quartile values. The whiskers represent the most extreme values within 1.5 times the interquartile range from the ends of the box.
Abbreviations: VAS, visual analog scale; TMG, traditional massage therapy group; SMG, experimental massage therapy group; T0, baseline; T1, end of the treatment program; T2, 3-month follow-up.
Abbreviations: VAS, visual analog scale; TMG, traditional massage therapy group; SMG, experimental massage therapy group; T0, baseline; T1, end of the treatment program; T2, 3-month follow-up.
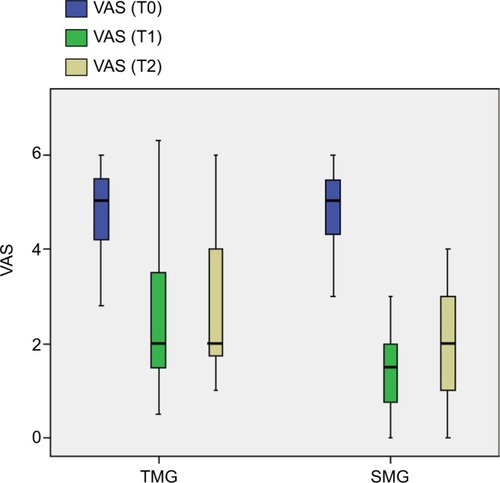
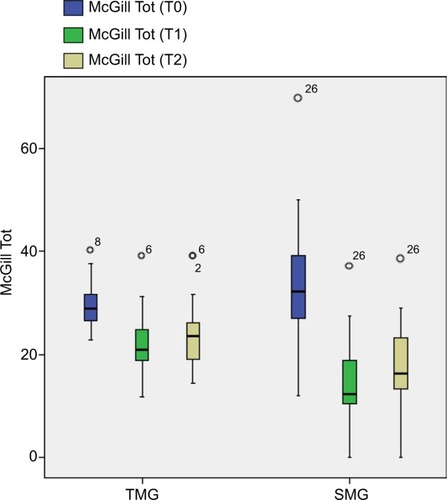
Figure 5 McGill Pain Questionnaire (McGill Tot) at T0, T1, and T2 for the two groups for Mann–Whitney U test.
Notes: The boxes show the lower quartile, median (middle line in box), and upper quartile values. The whiskers represent the most extreme values within 1.5 times the interquartile range from the ends of the box and the circles represent data with values beyond the ends of whiskers.
Abbreviations: TMG, traditional massage therapy group; SMG, experimental massage therapy group; Tot, total; T0, baseline; T1, end of the treatment program; T2, 3-month follow-up.
Abbreviations: TMG, traditional massage therapy group; SMG, experimental massage therapy group; Tot, total; T0, baseline; T1, end of the treatment program; T2, 3-month follow-up.