Figures & data
Figure 1 50% paw withdrawal threshold (A) in naïve mice and mice that underwent paw incision surgery, measured on days 1, 5, 7, and 12 in wild-type (WT, open circles [○] n=6) and in MKP-3 KO mice (closed circles [●] n=6). Data were analyzed using two-way ANOVA + Bonferroni post hoc analysis. *P<0.05, WT vs MKP-3 KO. Representative Western blot images (B) of hind paw plantar tissue MKP-3 and MKP-1 (β-actin was used as the loading control) in WT and MKP-3 KO naïve mice. Data are expressed as mean ± SEM.
![Figure 1 50% paw withdrawal threshold (A) in naïve mice and mice that underwent paw incision surgery, measured on days 1, 5, 7, and 12 in wild-type (WT, open circles [○] n=6) and in MKP-3 KO mice (closed circles [●] n=6). Data were analyzed using two-way ANOVA + Bonferroni post hoc analysis. *P<0.05, WT vs MKP-3 KO. Representative Western blot images (B) of hind paw plantar tissue MKP-3 and MKP-1 (β-actin was used as the loading control) in WT and MKP-3 KO naïve mice. Data are expressed as mean ± SEM.](/cms/asset/fa0ac5e6-b59c-4b90-8d30-616e4fd255d0/djpr_a_129826_f0001_b.jpg)
Figure 2 Representative images of H&E staining (A) (scale bar =100 µm) of paw tissue ipsilateral to incision of wild-type (WT) and MKP-3 KO mice, in naïve mice (left hind paw plantar tissue) and on days 1, 5, 7, and 12 after paw incision surgery. Cellular and nuclear morphology of some cells are shown in magnified inserted images (scale bar =20 µm). Quantification of the number of infiltrated cells (B) in paw tissue ipsilateral to incision of wild-type (WT) and MKP-3 KO mice, in naïve mice (left hind paw plantar tissue) and on days 1, 5, 7, and 12 after paw incision surgery (n=3/group). The number of polymorphonuclear cells (line pattern) and mononuclear cells (solid color) is represented within each bar. *P<0.05 vs naïve, Kruskal–Wallis tests followed by a Dunn test; #P<0.05 WT vs MKP-3 KO, Mann–Whitney U test. Data are expressed as mean ± SEM.
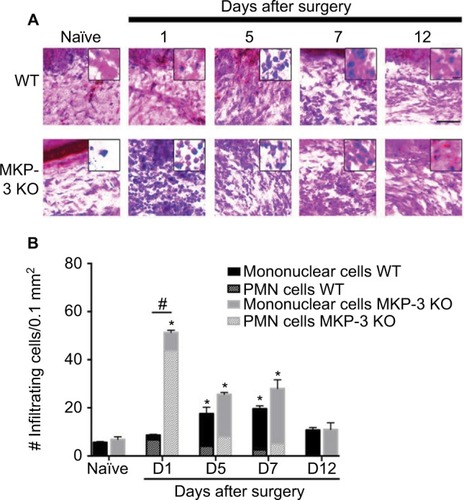
Figure 3 Representative Western blot images of p-ERK-1/2, total-ERK-1/2, p-p38, total-p38 and β-actin (loading control) from paw tissue of wild-type and MKP-3 KO mice, in naïve condition and on days 1, 5, 7, and 12 after paw incision surgery (A). Quantification of p-ERK-1/2 (B) and p-p38 (C) expression in the paw tissue of wild-type mice, and p-ERK-1/2 (D) and p-p38 (E) expression in the paw tissue of MKP-3 KO mice, in naïve condition and on days 1, 5, 7, and 12 after paw incision surgery (n=3/group). Data were normalized to naïve condition and analyzed using one-way ANOVA + Dunnett’s post-test, *P<0.05 vs naïve. Data are expressed as mean ± SEM.
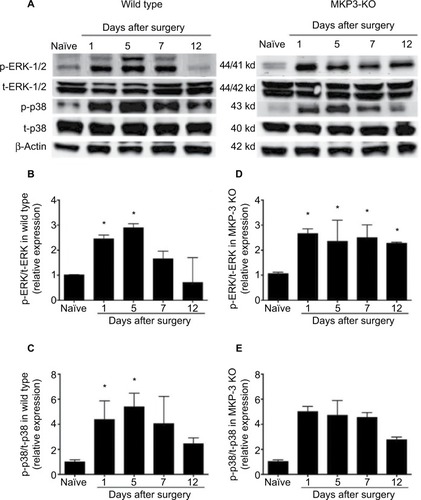
Figure 4 Representative Western blot images of MKP-1, MKP-3, and β-actin (loading control) from paw tissue of WT mice (A), in naïve condition and on days 1, 5, 7, and 12 after paw incision surgery, and representative Western blot images of MKP-1 and β-actin (loading control) from paw tissue of MKP-3 KO mice (B), in naïve condition and on days 1, 5, 7, and 12 after paw incision surgery. Quantification of MKP-3 expression in the paw tissue of WT (C) and of MKP-1 expression in the paw tissue of MKP-3 KO mice (D), in naïve condition and on days 1, 5, 7, and 12 after paw incision surgery (n=3/group). Data were analyzed using one-way ANOVA + Dunnett’s post-test (C) or two-way ANOVA + Bonferroni post hoc (D); *P<0.05 vs naïve. Data are expressed as mean ± SEM.
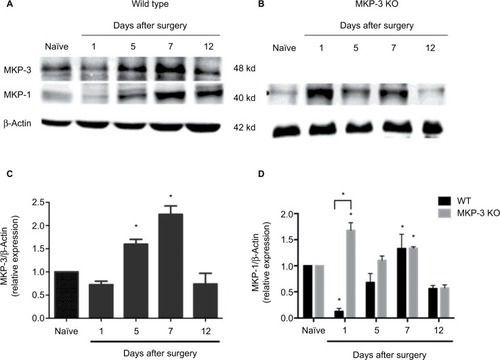
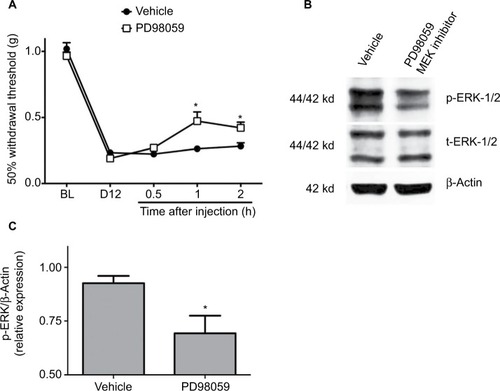
Figure 5 50% paw withdrawal threshold (A) in MKP-3 KO mice before (baseline, BL) and 12 days following paw incision (D12), and 0.5, 1, and 2 h following intraplantar administration of 25 nmol PD98059 (MEK-1/2 inhibitor, n=8) or vehicle (n=9) on postoperative day 12. Data were analyzed using two-way ANOVA + Bonferroni’s post hoc analysis. *P<0.05 vs vehicle. Representative Western blot images of p-ERK-1/2, total-ERK-1/2, and β-actin (loading control) (B) from paw tissue of MKP-3 KO mice (postoperative day 12) 2 h following intraplantar administration of PD98059 or vehicle. Quantification of p-ERK-1/2 expression (C) in paw tissue of MKP-3 KO mice (postoperative day 12) 2 h following intraplantar administration of PD98059 or vehicle (n=6 per group, five male mice and one female mouse, from each treatment group). Data were analyzed using one-way ANOVA + Bonferroni’s post hoc analysis. *P<0.05 versus vehicle. Data are expressed as mean ± SEM.