
Figures & data
Figure 1 Flow of participants through the study
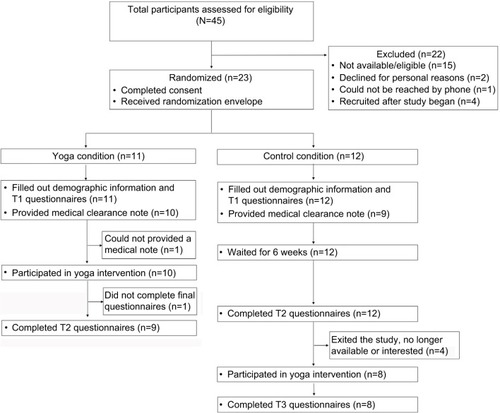
Table 1 Demographics of the sample (n=22) by group
Figure 2 Temporal sequence of the yoga interventions and data collection for both groups Iyengar yoga group
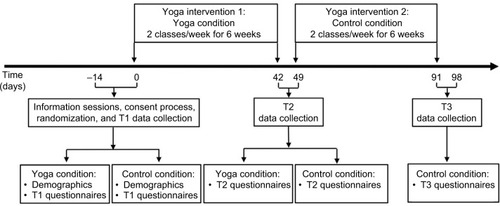
Table 2 Yoga philosophy concepts by class
Table 3 Variance across intercepts and change in −2LL for the combined groups
Table 4 Results from the mixed-model analysis (n=22)
Table 5 Mean (SD) values for psychological, mindfulness, and pain variables pre- (n=22) and postintervention (n=17) for all participants