
Figures & data
Table 1 Between-session reproducibility of cortical activities in two regions of interests (the anterior cingulate cortex and the insular cortex)
Figure 1 Cortical source activities evoked by cold pressor pain for the eight frequency bands.
Notes: Yellow and orange colors represent cortical areas with increased activity, whereas blue color represents cortical areas with decreased activity. Voxels colored orange and dark blue indicate areas with t-values closest to the threshold value, that is, the least significant findings.
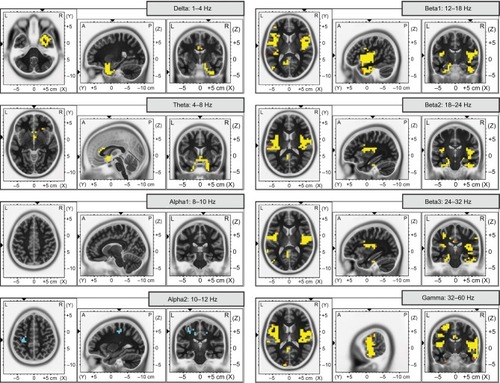
Table 2 Overview of cortical activities evoked by the cold pressor test in different frequency bands