Figures & data
Figure 1 Path analysis diagram that illustrates direct (BPI) and indirect (BDI-II) effects of treatment on improvement in pain symptoms. The direct analgesic effect is represented by α1, and the indirect analgesic effect is represented by α2 (improvement of depression) and β1 (improvement of pain due to improvement of depression).
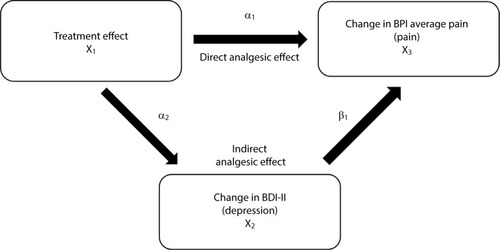
Figure 2 CONSORT diagram illustrating patient disposition.
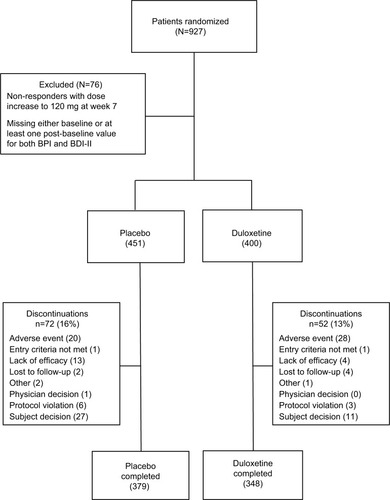
Table 1 Baseline demographics and clinical characteristics
Figure 3 Change at endpoint from baseline of BPI average pain scores for CLBP patients treated with duloxetine and placebo (A). * indicates significant (p<0.001, ANCOVA) difference from placebo. Change from baseline of BDI-II total scores for CLBP patients treated with duloxetine and placebo (B). * indicates significant (p=0.015, ANCOVA) difference from placebo. The error bars on graphs represent SE. Path analyses showing the percent of total analgesic effect attributed to a direct and indirect effect of duloxetine on pain (C).
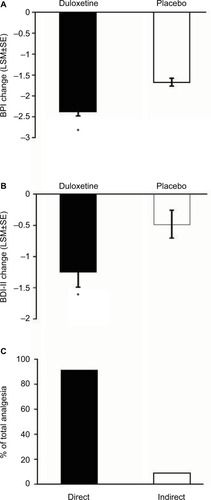
Figure 4 Change from baseline of BPI average pain scores at weeks 4, 7, and 13 for CLBP patients receiving duloxetine or placebo. Changes shown are the difference from the initial baseline BPI value (A). * indicates significant (p<0.001, ANCOVA) difference from placebo. Change from baseline of BDI-II total scores for CLBP patients treated with duloxetine and placebo. Changes shown are the difference from the initial baseline BDI-II value (B). * indicates significant (p=0.007 and 0.022, ANCOVA, at weeks 7 and 13, respectively) difference from placebo. The mean baseline BPI (±SD) and BDI-II (±SD) are shown for each group. Error bars on graphs represent SE. Path analyses showing the percent of total analgesic effect attributed to a direct and indirect effect of duloxetine on pain at each time point (C).
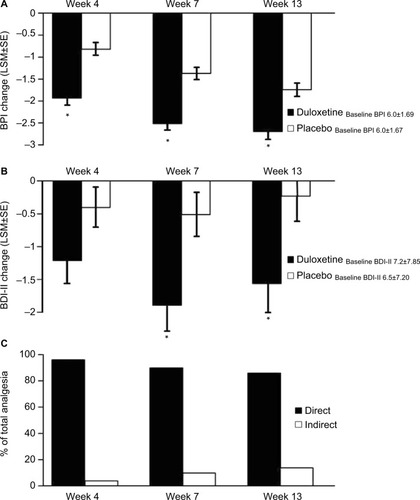
Figure 5 Subgroups formed from baseline BPI <6 (N=464) and BPI scores ≥6 (N=387). Endpoint change from baseline of BPI average pain scores for subgroups of CLBP patients receiving duloxetine or placebo (A). * indicates significant (p<0.001, ANCOVA) difference from placebo. Change from baseline of BDI-II total scores for subgroups of CLBP patients treated with duloxetine and placebo (B). * indicates significant (p=0.020, ANCOVA) difference from placebo. The mean baseline BPI (±SD) and BDI-II (±SD) are shown for each subgroup. Error bars on graphs represent SE. Path analyses showing the percent of total analgesic effect attributed to a direct and indirect effect of duloxetine on pain for each subgroup (C).
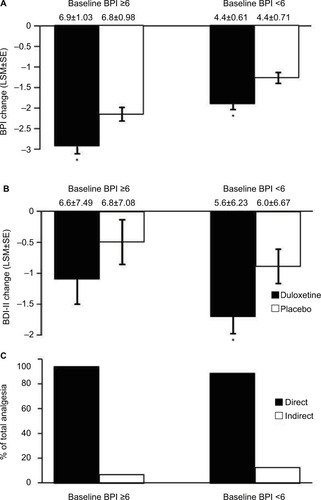
Figure 6 Subgroups formed from baseline BDI-II <6 (N=501) and BDI-II scores ≥6 (N=350). Endpoint change from baseline of BPI scores for both subgroups of CLBP patients receiving duloxetine or placebo (A). * indicates significant (p<0.001, ANCOVA, for BDI-II <6; p=0.003 for BDI-II ≥6) difference from placebo. Endpoint change from baseline of BDI-II scores for both subgroups of CLBP patients treated with duloxetine and placebo (B). * indicates significant (p=0.010, ANCOVA) difference from placebo. Error bars on graphs represent SE. The mean baseline BPI (±SD) and BDI-II (±SD) are shown for each group. Path analyses showing the percent of total analgesic effect attributed to a direct and indirect effect of duloxetine on pain for each subgroup (C). * indicates significant (p≤0.05, ANCOVA) difference from placebo.
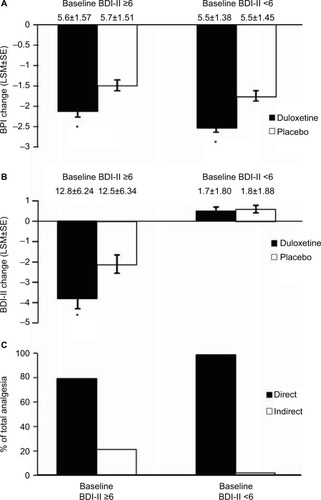
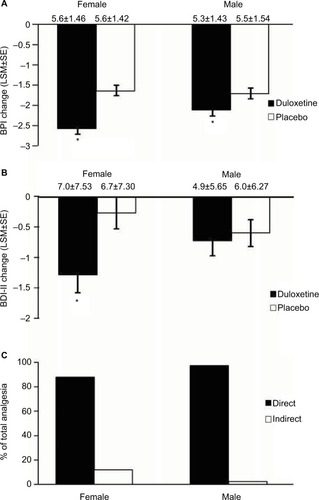
Figure 7 Subgroups formed from male (N=379) and female (N=472) CLBP patients. Endpoint change from baseline of BPI scores for female and male CLBP patients receiving duloxetine or placebo (A). * indicates significant (p<0.001, ANCOVA for females, p=0.031 for males) difference from placebo. Endpoint change from baseline of BDI-II scores for female and male CLBP patients treated with duloxetine and placebo (B). * indicates significant (p=0.008, ANCOVA) difference from placebo. The mean baseline BPI (±SD) and BDI-II (±SD) are shown for each group. Error bars on graphs represent SE. Path analyses showing the percent of total analgesic effect attributed to a direct and indirect effect of duloxetine on pain for female and male CLBP patients (C). * indicates significant (p≤0.05, ANCOVA) difference from placebo.