
Figures & data
Figure 1 Enrollment of CBP patients (t1 = beginning of back pain rehabilitation, t2 = 6 months after back pain rehabilitation).
Abbreviations: CBP, chronic back pain; n, number of participants
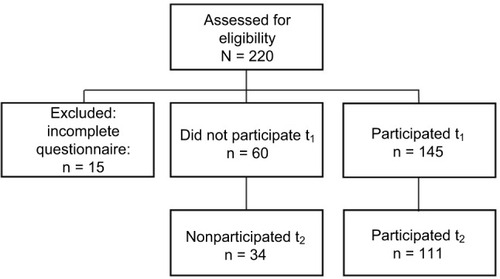
Figure 2 CFA using a two-factor model “disability due to pain” (CF-D) and “experience of pain” (CF-PE).
Abbreviations: CFA, confirmatory factor analysis; CPG, Chronic Pain Grade Questionnaire; SF-36, Short-Form Health Survey; WAI, Work Ability Index; BSI, Brief Symptom Inventory; SBL, Schmerzbeschreibungsliste (pain description list); CF-PE, chronification factor pain experience; CF-D, chronification factor disability.
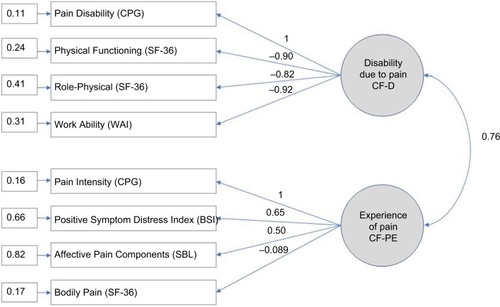
Table 1 Descriptives of participants at baseline (n = 145)
Table 2 Prediction of CF-PE and CF-D at t1 (beginning of back pain rehabilitation) using lifestyle/demography, medical care situation and profession
Table 3 Prediction of CF-D and CF-PE at t1 (beginning of back pain rehabilitation) using lifestyle/demography and profession
Table 4 Results from separate multiple regression analyses predicting CF-PE and CF-D from established and often neglected risk factors of CBP