Figures & data
Table 1 Baseline parameter values and 3-hour area under the time-effect curve for end-tidal CO2 and sedation
Figure 1 Effect of fentanyl on heat pain scores in 2 groups of subjects. A and C, One group received intravenous 2.1 μg/kg fentanyl at 8 am and 8 pm; B and D, the other group at 2 pm and 2 am. Values are mean ± SD. Baseline values (ie, predrug values) are given at time t = 0.
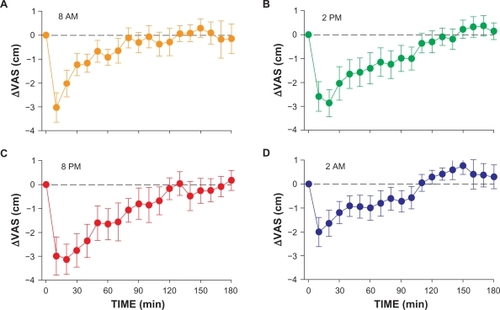
Figure 2 Mean pain scores relative to baseline (ie, ΔVAS with baseline = 0 at time t = 0) after injection of 2.1 μg/kg fentanyl observed at 2 am, 8 am, 2 pm, and 8 pm.
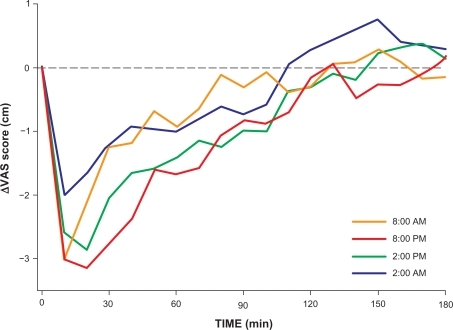
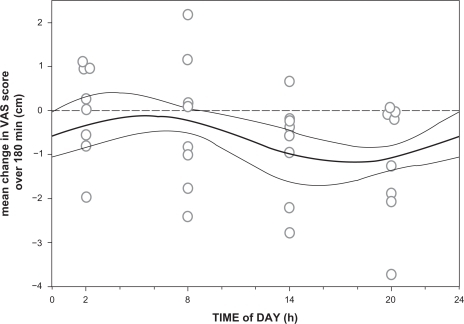
Figure 3 Data fit of analgesic effect from 2.1 μg/kg intravenous fentanyl vs time of day at which the drug was injected. Analgesic effect is defined as the mean change in VAS over the 180-minutes study period. Each circle represents the analgesic effect of one subject. The fit is a sinusoidal curve (thick continuous line) ±95% confidence interval (thin continuous lines). The broken line denotes a separation between mean analgesic responses (data below the broken line) and hyperalgesic responses (above the broken line).