
Figures & data
Figure 1 Scatter plots visualizing individual responses for those outcomes that showed statistically significant changes at six months. The X-axis represents the score at baseline, and the Y-axis the score at 6 months after the intervention.
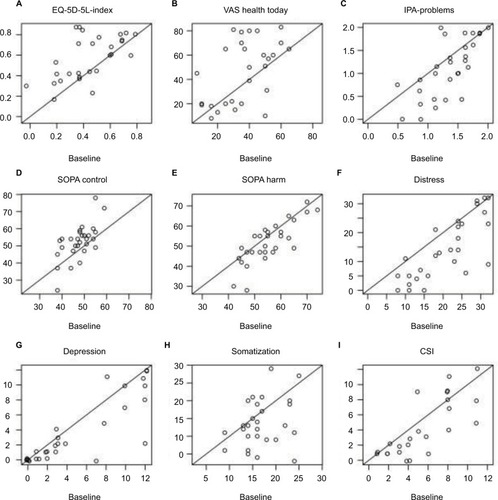
Table 1 Mean (SD) (minimum–maximum) EQ-5D-5L-Index, VAS Health Today, IPA-Limitations, and IPA-Problems values at baseline and at 1, 3, and 6 months after intervention
Table 2 Mean (SD) (minimum–maximum) values for VAS Actual, Minimum and Maximum pain, SOPA attitudes Control, Emotion, Disability, Harm, Medication, Solicitude, and Medical, and 4DSQ symptoms Distress, Depression, Anxiety, and Somatization at baseline and at 1, 3, and 6 months after intervention
Table 3 CSI (mean) (SD) (minimum–maximum) values at baseline and at 1, 3, and 6 months after intervention; CSI percentage changes (mean) (SEM) (median) post-intervention; and the number (Nr) (percentage) of support partners with a CSI ≥7 at various time points
Table 4 Mean percentage change (standard error) (median) from baseline for the primary and secondary outcome measures