
Figures & data
Figure 1 The forward- and back-translation process of the questionnaire.
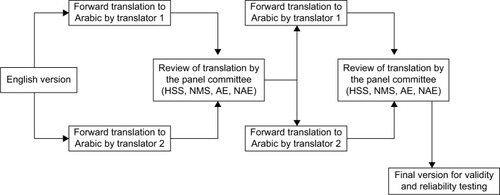
Table 1 Participants’ characteristics (n=232)
Table 2 The difference between interviewers’ diagnoses and neurologists’ diagnoses
Table 3 Validity testing (sensitivity, specificity, positive predictive value, and negative predictive value, with 95% CI) from the randomly selected headache subsample
Table