Figures & data
Table 1 Demographic and baseline characteristics
Figure 1 Changes from baseline (±SE) in TWA NPRS from 0 to 24 hours by treatment group.
Notes: Loading/patient-controlled demand doses (mg/mg): oliceridine regimen A, 1.5/0.10; oliceridine regimen B, 1.5/0.35; morphine, 4.0/1.0. P=0.0001, oliceridine regimen A versus placebo; P=0.0005, oliceridine regimen B versus placebo; P<0.0001, morphine versus placebo.
Abbreviations: SE, standard error; TWA, time-weighted average; NPRS, numeric pain rating scale.
Abbreviations: SE, standard error; TWA, time-weighted average; NPRS, numeric pain rating scale.
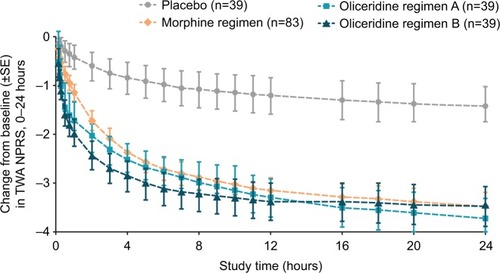
Figure 2 Least square mean change from baseline in TWA NPRS, 5 minutes after second loading dose, by treatment group.
Notes: Loading/patient-controlled demand doses (mg/mg): oliceridine regimen A, 1.5/0.10; oliceridine regimen B, 1.5/0.35; morphine, 4.0/1.0. *P<0.05 versus placebo; $P<0.05 versus morphine (least square mean difference).
Abbreviations: TWA, time-weighted average; NPRS, numeric pain rating scale.
Abbreviations: TWA, time-weighted average; NPRS, numeric pain rating scale.
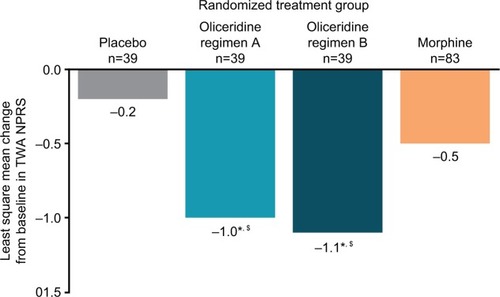
Figure 3 Median time to onset of meaningful pain relief by treatment group.
Notes: Loading/patient-controlled demand doses (mg/mg): oliceridine regimen A, 1.5/0.10; oliceridine regimen B, 1.5/0.35; morphine, 4.0/1.0.
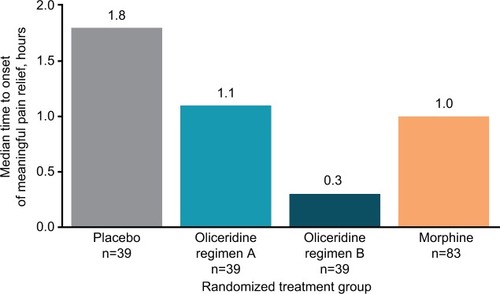
Table 2 TEAEs in ≥10% of patients
Figure S1 Patient disposition.
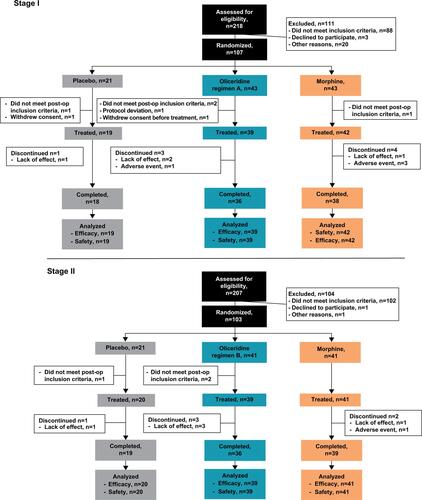
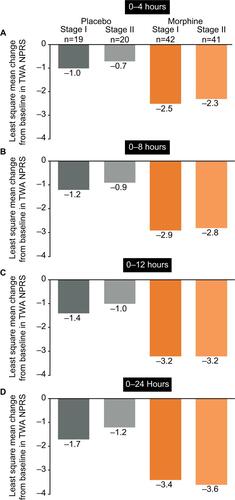
Figure S2 Least squares mean change from baseline in TWA NPRS from (A) 0–4 hours, (B) 0–8 hours, (C) 0–12 hours, and (D) 0–24 hours with placebo and morphine by study stage.
Note: Loading/patient-controlled demand doses (mg/mg): morphine, 4.0/1.0.
Abbreviations: TWA, time-weighted average; NPRS, numeric pain rating scale.