Figures & data
Figure 1 Linear plot of mean plasma concentrations (μg/mL) versus time profile of diclofenac sodium for test and reference formulations in 10 obese (BMI > 25) male subjects under fasting conditions.
Abbreviations: SEM, standard error of mean; BMI, body mass index.
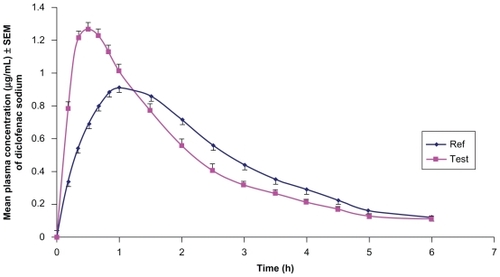
Table 1 Mean pharmacokinetic parameters in 10 obese male volunteers following intragluteal administration of the reference formulation (diclofenac sodium 75 mg/3 mL) and test formulation (diclofenac sodium 75 mg/1 mL)
Table 2 Point estimate, 90% and 95% confidence intervals for the ratio of the product averages of test and reference formulations
Table 3 Summary statistics of diclofenac sodium in 10 obese adult subjects under fasting conditions