Figures & data
Figure 1 Pictures showing the EA points (1–42) and EA procedure.
Abbreviation: EA, electro-acupuncture.
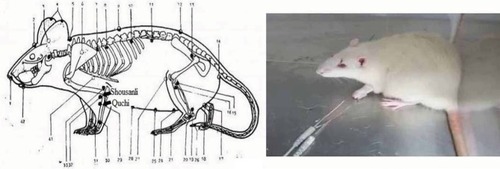
Figure 2 Frequency and length of face grooming and exploratory behavior were observed before the operation and at eight postoperative time points.
Abbreviation: EA, electro-acupuncture.
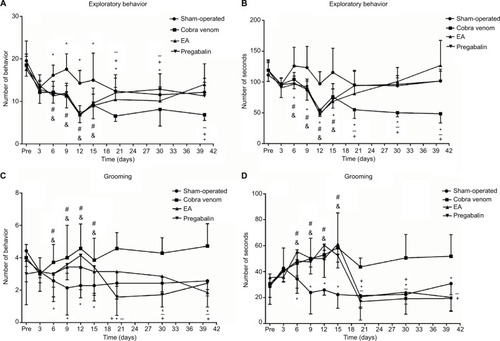
Figure 3 (A–D) Morris water maze training. (E, F) Morris water maze probe trial.
Abbreviations: ANOVA, analysis of variance; EA, electro-acupuncture.
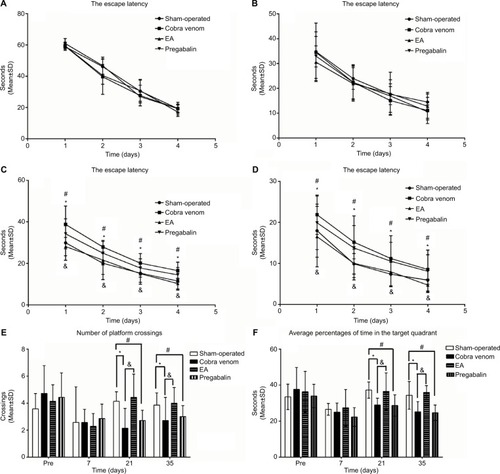
Figure 4 (A) The normal Gasserian ganglion, (B) medulla oblongata and (C) hippocampus. Electron microscopy showed that the structure of myelin sheaths and axon was entire (marked by arrows). (D) Gasserian ganglion, (E) medulla oblongata and (F) hippocampus with cobra venom injection. Electron microscopy showed severe demyelination and loss of axons (marked by arrows). The structure of myelin was disturbed and the layers were altered. The ultrastructure of neurons in hippocampus was altered obviously. Swelling of mitochondria and severe vacuolar degeneration in cells were observed. (G) Gasserian ganglion, (H) medulla oblongata and (I) hippocampus after EA treatment. Electron microscopy showed mild demyelination and loss of axons (marked by arrows). Microscopic examination of hippocampus neurons showed mild vacuolar degeneration and swelling of mitochondria in cells. (J) Gasserian ganglion, (K) medulla oblongata and (L) hippocampus after pregabalin treatment. Electron microscopy showed mild demyelination and loss of axons in part (marked by arrows). Microscopic examination of hippocampus neuron showed moderately severe vacuolar degeneration and swelling of mitochondria in cells.
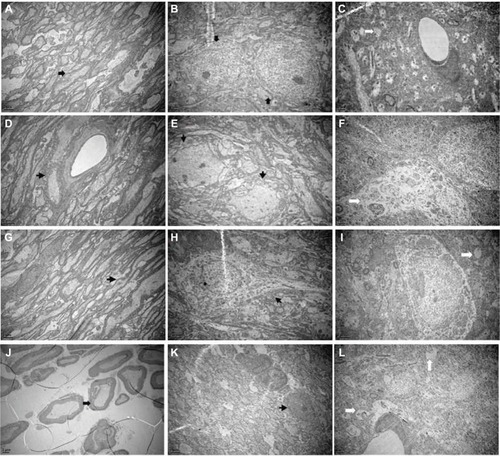
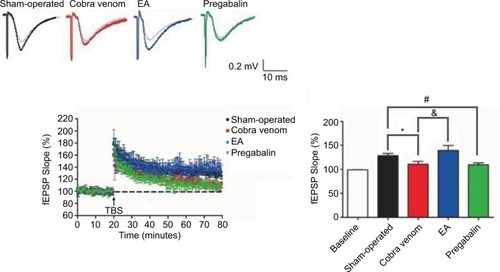
Figure 5 The fEPSP slope reveals differential time-dependent alternations in hippocampus CA1 in different groups.
Abbreviations: ANOVA, analysis of variance; EA, electro-acupuncture; fEPSP, field excitatory postsynaptic potential; TBS, Theta-burst stimulation.