
Figures & data
Figure 1 Study flowchart.
Abbreviation: WHO, World Health Organization.
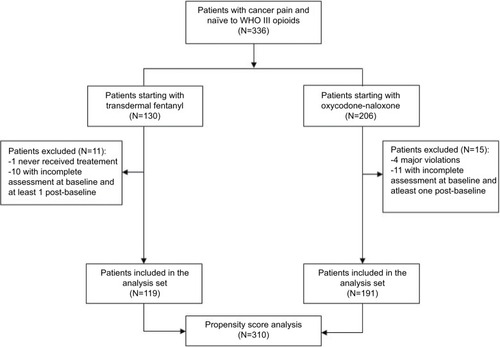
Table 1 Main baseline demographic and clinical characteristics of the study population
Table 2 Study adherence
Figure 2 Mean pain intensity score (11-point numerical rating scale) throughout observation after transdermal fentanyl and prolonged-release oxycodone-naloxone.
Abbreviation: OXN, oxycodone-naloxone.
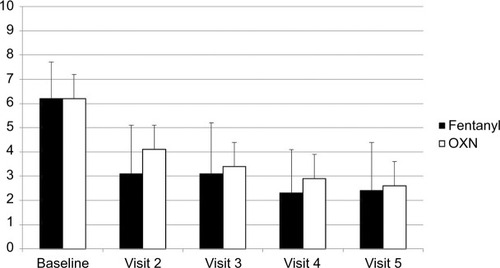
Table 3 Clinical measures and end points
Figure 3 Transdermal fentanyl and prolonged-release oxycodone-naloxone daily dosages (expressed in oral morphine-equivalent daily dose).
Abbreviations: OMEDD, oral morphine-equivalent daily dose; OXN, oxycodone-naloxone.
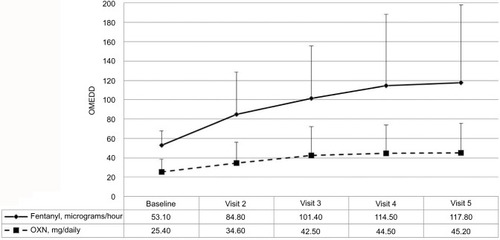
Table 4 Patients with adverse drug reactions in each treatment arm