Figures & data
Figure 1 Hematoxylin and eosin (H&E) stains of ipsilateral distal femur. Histological sections of the ipsilateral femoral epiphysis from vehicle (A) and MLL (MATLyLu) cell injected (B) rats. Visible in the figure is eroded trabecular bone (arrow). Sections were stained with H&E. M, marrow, B, bone, T, tumor. Bar represents 100 μm.
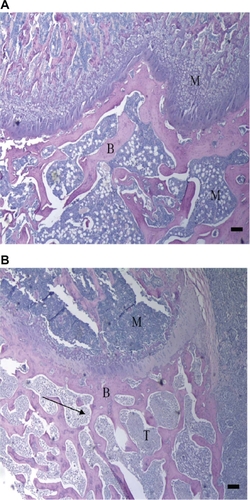
Figure 2 Radiographs of rat ipsilateral hind legs. Radiographs of the ipsilateral hind leg from vehicle (A) and MATLyLu (MLL) cell injected (B) rats displaying structural changes following model induction. Compared to vehicle, the radiograph from the MLL cell injected rat displayed acute osteopenia within the distal portion of the ipsilateral femur involving the distal femoral metadiaphysis (black arrow), metaphysis (white arrow), and epiphysis (black hatched arrow). Also visible in the radiograph of the MLL cell injected ipsilateral hind leg was cortical destruction in the anterior aspect of the metaphysis and metadiaphysis with periosteal reaction (white arrowhead). Joint effusion within the MLL cell-injected ipsilateral femur was also visible in the radiograph (black arrowhead).
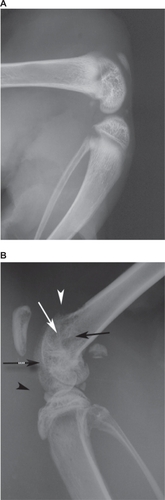
Figure 3 Computed tomography scans of rat ipsilateral hind legs. (A) Anterior view of the ipsilateral leg from a vehicle injected rat. (B) Anterior view of the ipsilateral leg from a MATLyLu (MLL) cell-injected rat. Structural damage in the form of trabecular and periosteal bone erosion is visible in the ipsilateral epiphysis from the MLL cell-injected rat with an absence of damage in the same region from the vehicle-injected rat.
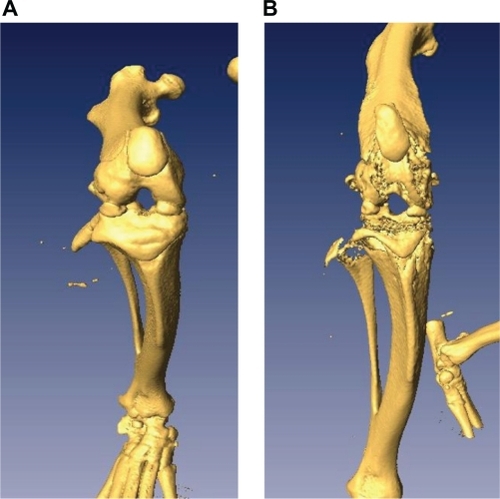
Figure 4 Difference in bodyweight following model induction. Change in bodyweight in vehicle (n = 12, ○, 223.5 g at BL) and MLL cell (n = 10, •, 228.4 g at BL) rats following injection. Data are displayed as mean ± SD. ***P < 0.001.
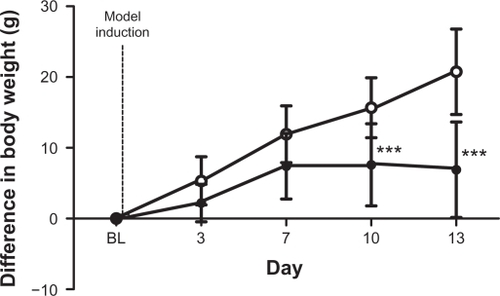
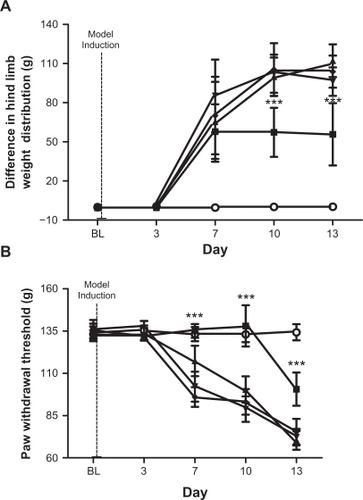
Figure 5 (A) Incapacitance test results. Figure displays the differential hind leg weight distribution in vehicle (n = 8, ○) and MLL (n = 10, •) cell injected rats. Hind limb weight difference was measured in grams (g). Data are displayed as mean ± SD. At BL, both groups displayed no significant difference in weight distribution between both hind legs. Dotted line indicates point of model induction. ***P < 0.001. (B) Randall–Selitto test results. Figure displays the paw withdrawal threshold in vehicle (n = 8, ○) and MLL (n = 10, •) cell-injected rats. Paw withdrawal threshold was measured in grams (g) of force. Data are displayed as mean ± SD. Dotted line indicates point of model induction. ***P < 0.001.
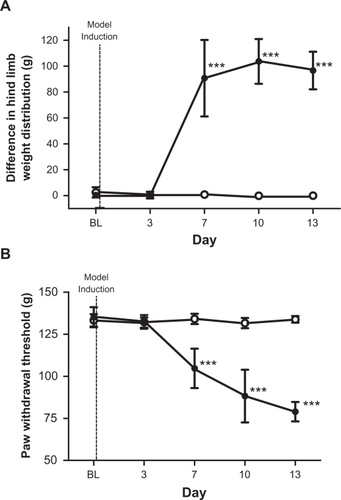
Figure 6 (A) Meloxicam effects in incapacitance test. Effect of meloxicam on differential hind leg weight distribution in PBS-injected (ie, no MLL cells), vehicle (ie, 0.5% methyl cellulose to MLL cell-injected rats) and in MLL cell-injected rats. PBS (○, n = 8), vehicle (♦ n = 9), 1.0 mg/kg meloxicam (▾, n = 9), 2.5 mg/kg meloxicam (▴, n = 8) and 5.0 mg/kg meloxicam (▪, n = 7) groups are displayed. Data are displayed as mean ± SD. ***P < 0.001. B) Meloxicam effects in Randall–Selitto test. Change in ipsilateral hind paw withdrawal threshold from the Randall–Selitto pressure clamp following administration of meloxicam or 0.5% methyl cellulose solution. Vehicle (○, n = 8), PBS (♦ n = 9), 1.0 mg/kg meloxicam (▾, n = 9), 2.5 mg/kg meloxicam (▴, n = 8) and 5.0 mg/kg meloxicam (▪, n = 7) groups are displayed. Data are displayed as ± SD. ***P < 0.001.