
Figures & data
Table 1 The primers of 3 lncRNAs used in this study
Figure 1 The paw withdrawal mechanical thresholds (PWMTs) at baseline and 7 days after modeling are presented as mean ± standard error (n=6). ****P<0.0001 indicates a statistically significant difference when compared to its baseline and Sham group and ##P<0.001 indicates a statistically significant difference when compared to the V-SNI group.
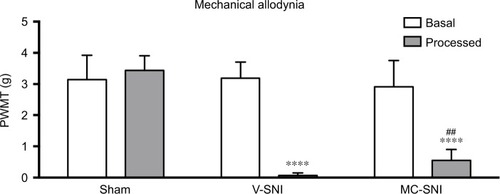
Figure 2 Scatter plots compare the expression of lncRNAs and mRNAs between the sham versus V-SNI group (A and B), and V-SNI versus MC-SNI group (C and D). The values of X and Y axes in the scatter plot are the averaged normalized values in each group (log2 scaled). The green lines indicate a fold change value of 2.0. The transcripts above the top green line and below the bottom green line indicate more than 2-fold changes between pairs. In total, 113 lncRNAs in B1 and 66 in B2 were listed in heat maps E and F; and 47 mRNAs in B1 and 52 in B2 were listed in heat maps G and H. In the heat maps, each column represents a microarray group, while each row represents a regulated gene. The color scale illustrates the relative expression level of lncRNAs: red denotes rich abundance and green denotes poor abundance. Percentages of each pattern for lncRNAs and mRNAs were shown in donut charts (I and J). Pattern A included genes that were modulated only by SNI, whereas pattern B represented genes that were modulated by both SNI and repeated minocycline administration. B1 - genes upregulated by SNI and then downregulated by minocycline, B2 - genes downregulated by SNI and then upregulated by minocycline, B3 - genes upregulated by SNI and further upregulated by minocycline, and B4 - genes downregulated by SNI and further downregulated by minocycline.
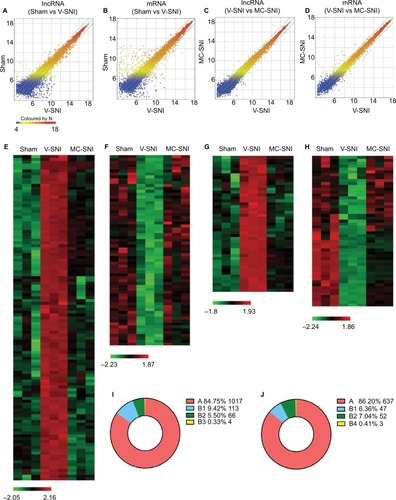
Figure 3 The fold changes of the detected lncRNAs NR_015491, ENSMUST00000174263, and ENSMUST00000146263 using microarray (A, C, and E) and qRT-PCR (B, D, and F) were listed. The statistical analysis for each comparison was performed using ANOVA and Turkey’s correction. *P<0.05, **P<0.01, and ****P<0.0001 indicate a statistically significant difference when compared to the sham group; #P<0.05, ###P<0.001, and jpr-10-2503P<0.0001 indicate a significant difference when compared to V-SNI.
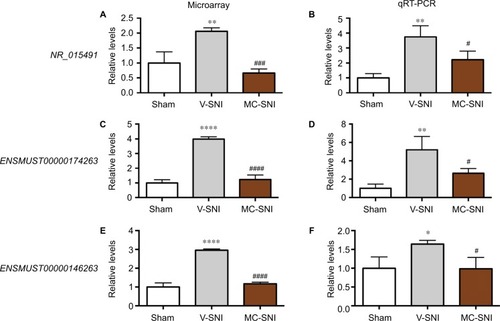
Figure 4 Distribution of four lncRNA classes. The distribution of intergenic, sense, antisense, and bidirectional lncRNAs is identified. Blue, green, and yellow colors indicate the number of DE lncRNAs with expression pattern B1, B2, or B3 in each class. Pattern B represented genes that were modulated by both SNI and repeated minocycline administration. B1 - genes upregulated by SNI and then downregulated by minocycline, B2 - genes downregulated by SNI and then upregulated by minocycline, and B3 - genes upregulated by SNI and further upregulated by minocycline.
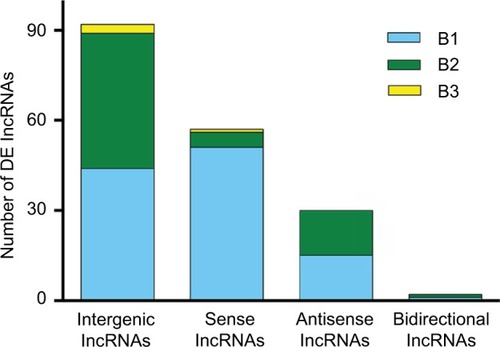
Figure 5 (A) The enriched molecular function annotations for DE mRNAs from sham versus V-SNI groups. (B) Part of the P-value annotation tree was displayed to reveal chemokine activity and its greatly enriched related annotations. (C and D) The enriched molecular function and biological process annotations for DE mRNAs from V-SNI versus MC-SNI. GO results are presented as descending enrichment scores.
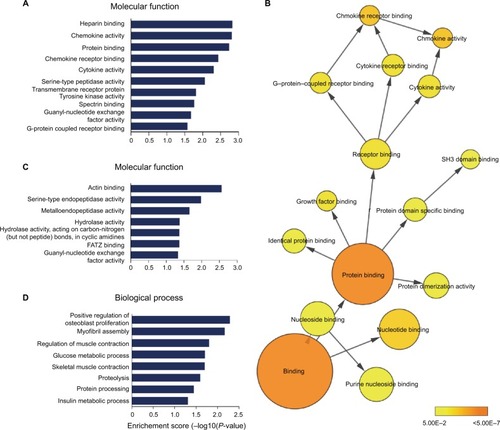
Table 2 Molecular function annotation enrichment results comparing sham versus V-SNI
Table 3 Molecular function annotation enrichment results comparing V-SNI versus MC-SNI