Figures & data
Figure 1 Anatomy of the fascia iliaca compartment block.
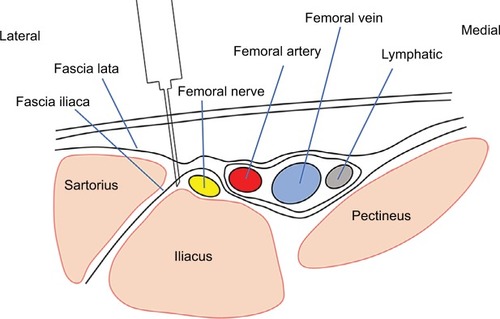
Figure 2 Flow diagram of the study selection process.
Abbreviations: FICB, fascia iliaca compartment block; RCTs, randomized controlled trials.
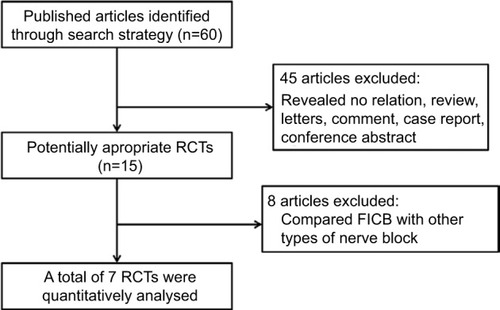
Table 1 The general characteristic of the included studies
Figure 3 Forest plots of studies comparing FICB and NB for pain score after LLS.
Note: Weights are from random effects analysis.
Abbreviations: FICB, fascia iliaca compartment block; LLS, lower limb surgery; NB, no block; SMD, standard mean difference.
Abbreviations: FICB, fascia iliaca compartment block; LLS, lower limb surgery; NB, no block; SMD, standard mean difference.
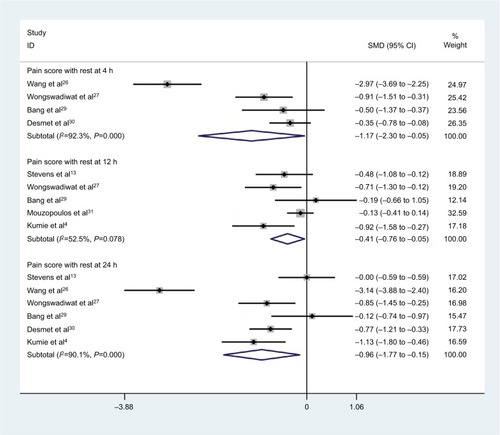
Table 2 Pooled results according to subgroup analysis
Figure 4 Sensitivity analysis for the pain score after LLS.
Abbreviation: LLS, lower limb surgery.
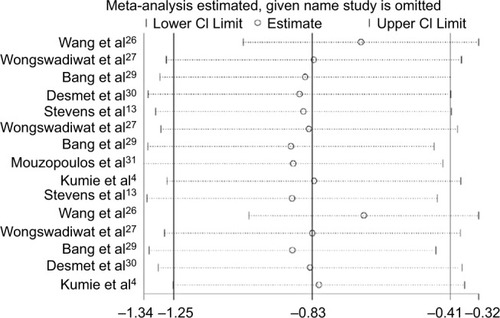
Figure 5 Forest plots of studies comparing fascia iliaca compartment block and no block in terms of morphine consumption at 24 h after lower limb surgery.
Note: Weights are from random effects analysis.
Abbreviation: RR, relative risk.
Abbreviation: RR, relative risk.
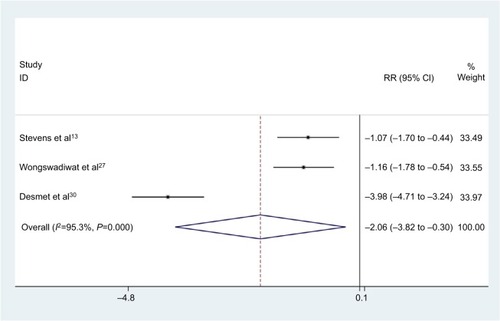
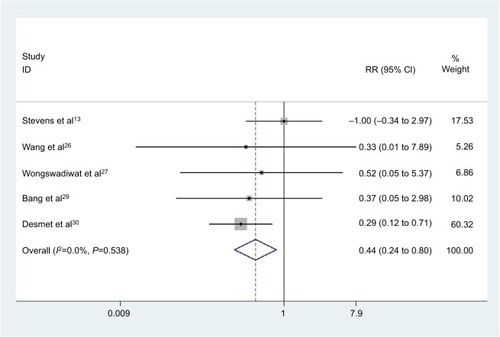
Figure 6 Forest plots of studies comparing postoperative nausea and vomiting between the fascia iliaca compartment block and no block groups.
Abbreviation: RR, relative risk.