
Figures & data
Figure 1 Schematic illustration of timing of pain ratings and therapy for subjects included in the study cohort.
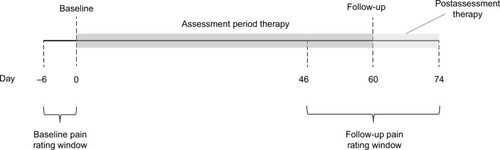
Table 1 Demographics and pain characteristics of study cohort
Table 2 Self-reported painful health conditions
Table 3 Anatomical distribution of pain
Table 4 FS-TENS therapy over 60-day assessment period
Table 5 Changes in pain measures from baseline to 60-day follow-up in FS-TENS users