Figures & data
Table 1 Primers used for polymerase chain reaction
Figure 1 Expression of COX-2 (A), TLR4 (B), and SR-A (C) mRNA in THP-1 macrophages under normal glucose (5 mM), high glucose (15 mM), or mannitol (10 mM) conditions after LPS stimulation or without any stimulation after 24 or 48 hours.
Notes: The mRNA expression for each gene was normalized to the respective levels of β-actin in each group and calculated as the fold change against the unstimulated 5 mM glucose control group. N = 10–18. *P < 0.05 vs. respective no LPS group. #P < 0.05 between groups, by two-way ANOVA followed by Bonferroni post hoc test.
Abbreviations: COX-2, cyclooxygenase-2; TLR4, toll-like receptor-4; SR-A, class A scavenger receptor; LPS, lipopolysaccharide; ANOVA, analysis of variance.
Abbreviations: COX-2, cyclooxygenase-2; TLR4, toll-like receptor-4; SR-A, class A scavenger receptor; LPS, lipopolysaccharide; ANOVA, analysis of variance.
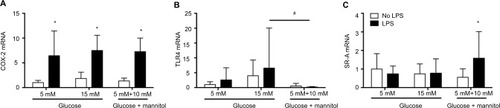
Figure 2 Cytokine concentration in THP-1 macrophages under normal glucose (5 mM), high glucose (15 mM), or mannitol conditions.
Notes: Quantification of IL-6 (A), MCP-1 (B), TNF-α (C), and IL-10 (D) after stimulation with LPS or without any stimulation after 24 hours. N = 11–18. *P < 0.05 vs. respective no LPS group. #P < 0.05 between groups, by two-way ANOVA followed by Bonferroni post hoc test.
Abbreviations: IL, interleukin; MCP, monocyte chemoattractant protein; TNF, tumor necrosis factor; LPS, lipopolysaccharide; ANOVA, analysis of variance.
Abbreviations: IL, interleukin; MCP, monocyte chemoattractant protein; TNF, tumor necrosis factor; LPS, lipopolysaccharide; ANOVA, analysis of variance.
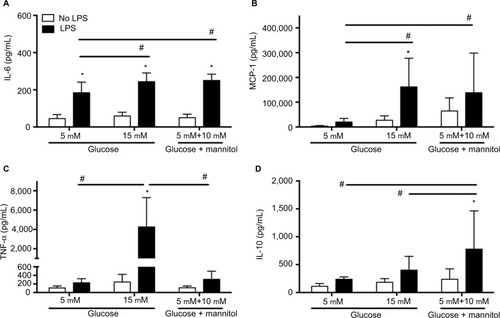
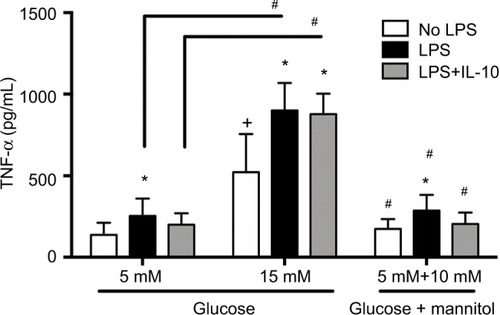
Figure 3 TNF-α protein concentration in THP-1 macrophages under normal glucose (5 mM), high glucose (15 mM), or mannitol (10 mM) conditions.
Notes: Quantification of TNF-α 6 hours after LPS stimulation, LPS + IL-10 stimulation, or no stimulation. N = 13 – 16. *P < 0.05 vs. respective no LPS group. +P < 0.05 vs. 5 mM no LPS. #P < 0.05 between connecting lines or vs. the corresponding 15 mM groups, by two-way ANOVA followed by Bonferroni post hoc test.
Abbreviations: TNF, tumor necrosis factor; LPS, lipopolysaccharide; IL, interleukin; ANOVA, analysis of variance.
Abbreviations: TNF, tumor necrosis factor; LPS, lipopolysaccharide; IL, interleukin; ANOVA, analysis of variance.