Figures & data
Figure 1 Timeline of the experimental procedure.
Abbreviations: NFCS, Neonatal Facial Coding System; NIRS, near infrared spectroscopy.
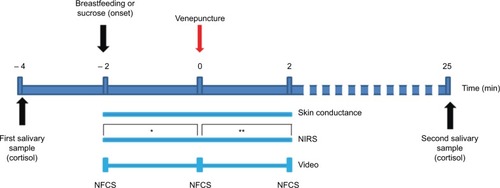
Figure 2 Flowchart of patient selection.
Abbreviations: NFCS, Neonatal Facial Coding System; NIRS, near infrared spectroscopy.
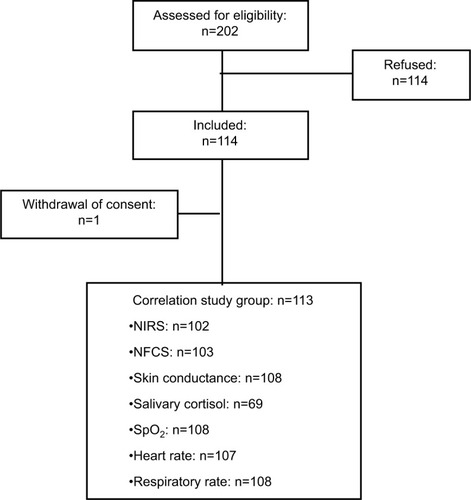
Table 1 Demographic characteristics of the study sample, grouped by the type of measurement performed
Table 2 Parameter values analyzed to assess changes in responses measured before (–), during (0 s), and after (+) venepuncture
Table 3 Correlation analysis: Pearson and Spearman correlation coefficients show associations between the different parameters analyzed
Figure 3 Graphic representations (boxplots) of the significant correlations between NFCS, assessed at the time of the venepuncture (0 min), and changes in various parameters. (A) Change in [HbO2] (Δ: max [HbO2] at +20 s − mean [HbO2] at −20 s); (B) change in [HbT] (Δ: max [HbT] at +20 s − mean [HbT] at −20 s); (C) change in salivary cortisol concentrations (Δ: [cortisol] at +25 min − at −4 min); and (D) change in skin conductance (Δ: peaks/s at +2 min − peaks/s at −2 min).
Abbreviations: HbO2, oxygenated hemoglobin; HbT, total hemoglobin; NFCS, Neonatal Facial Coding System.
![Figure 3 Graphic representations (boxplots) of the significant correlations between NFCS, assessed at the time of the venepuncture (0 min), and changes in various parameters. (A) Change in [HbO2] (Δ: max [HbO2] at +20 s − mean [HbO2] at −20 s); (B) change in [HbT] (Δ: max [HbT] at +20 s − mean [HbT] at −20 s); (C) change in salivary cortisol concentrations (Δ: [cortisol] at +25 min − at −4 min); and (D) change in skin conductance (Δ: peaks/s at +2 min − peaks/s at −2 min).](/cms/asset/cc60c5fa-5bbb-462f-8b18-353cce1fdbd4/djpr_a_165810_f0003_b.jpg)
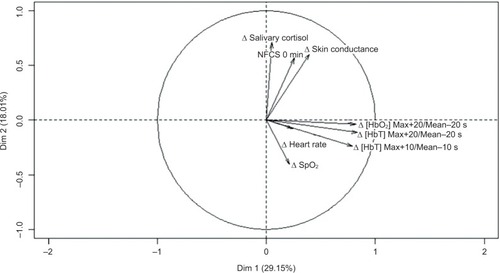
Figure 4 Variable factor map representing the two main dimensions (Dim 1, Dim 2) from the principal components analysis.
Abbreviations: Dim, dimension; HbO2, oxygenated hemoglobin; HbT, total hemoglobin; NFCS, Neonatal Facial Coding System.