Figures & data
Figure 1 CONSORT diagram for the study.
Abbreviation: CONSORT, consolidated standards of reporting trials.
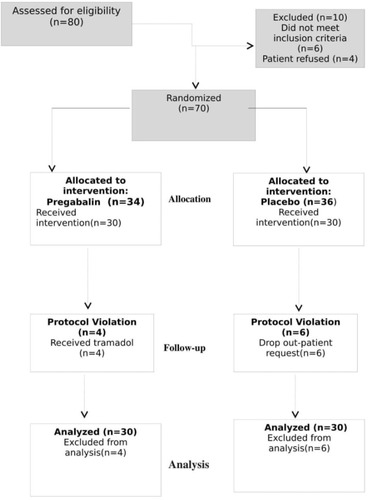
Table 1 Baseline characteristics and operative data
Table 2 Quality of recovery measured using the QoR-40 questionnaire (40–200) and hospitalization time according to the intervention group
Table 3 Subcomponents of the QoR-40 questionnaire by study groups evaluated 24 hours after surgery
Table 4 Occurrence of painTable Footnotea, nausea, vomiting, and morphine consumption in the postoperative period according to the intervention group
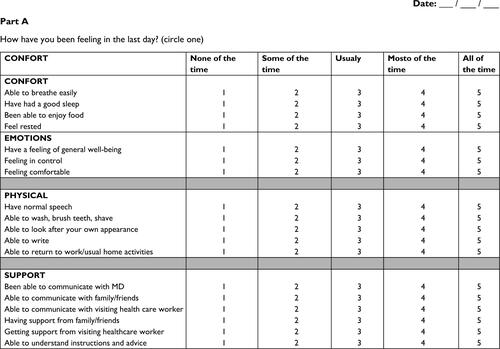
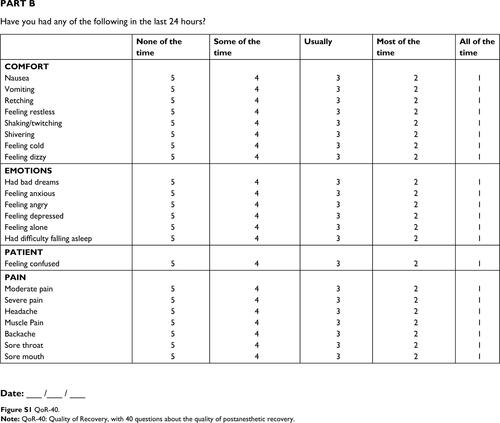
Figure S1 QoR-40.
Note: QoR-40: Quality of Recovery, with 40 questions about the quality of postanesthetic recovery.