
Figures & data
Figure 1 Summary of PCP.
Notes: This figure depicts the flow of PCP in Phase 3, after participants have undergone information manipulation. The single-headed arrow (→) denotes the sequence of the procedure from one step to another. TB indicates baseline temperature, at which participants reported feeling uncomfortable.
Abbreviation: PCP, pain calibration procedure.
Abbreviation: PCP, pain calibration procedure.
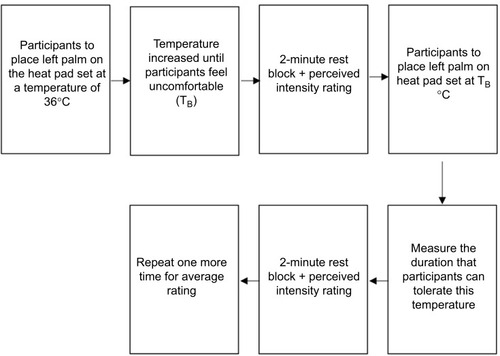
Figure 2 Predicted anticipation model.
Notes: This figure depicts the structural equation modeling used to analyze the influence of pain anticipation, pain-related anxiety, and the moderating effect of pain-related anxiety on pain perception. The rectangles () represent observed variables, while the ellipses () represent the unobserved latent factors. The single-headed arrows with solid lines (→) represent the path coefficient for regression of one variable on another. The double-headed arrows (↔) represent covariances or correlations between pairs of variables. Trait anxiety indicates pain-related trait anxiety. “×” in Anticipation × Trait anxiety box indicates the interaction between anticipation and pain-related trait anxiety. e1 indicates measurement error for pain threshold reading; e2 indicates measurement error for pain tolerance reading; e3 indicates measurement error for perceived pain intensity rating.
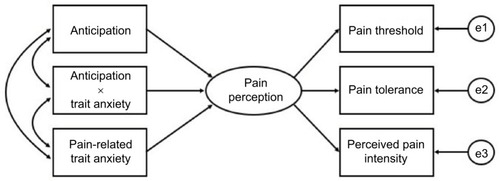
Figure 3 Predicted attention model.
Notes: This figure depicts the structural equation modeling used to analyze the influence of attention strategies, pain-related anxiety, and the moderating effect of pain-related anxiety on the change in pain perception. The rectangles ([img]) represent observed variables, while the ellipses ([img]) represent the unobserved latent factors. The single-headed arrows with solid lines (→) represent the path coefficient for regression of one variable on another. The double-headed arrows (↔) represent covariances or correlations between pairs of variables. Trait anxiety indicates pain-related trait anxiety. “×” in Strategy × Trait anxiety box indicates the interaction between attention strategy and pain-related trait anxiety. e1 indicates measurement error for the change in pain threshold reading; e2 indicates measurement error for the change in pain tolerance reading; e3 indicates measurement error for the change in perceived pain intensity rating.
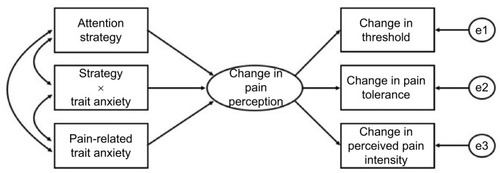
Table 1 Summary of anticipation model
Table 2 Direction of change in pain perception in attention groups
Figure 4 Interaction between attention task and pain-related trait anxiety.
Notes: The change in pain perception was measured as final – initial rating of the respective pain perception ratings. Participants in attention group (n=51) were told to pay attention to and verbalize the heat sensation that they felt on their palm. Participants in the distraction group (n=55) were told to engage in a game presented on a computer in front of them.
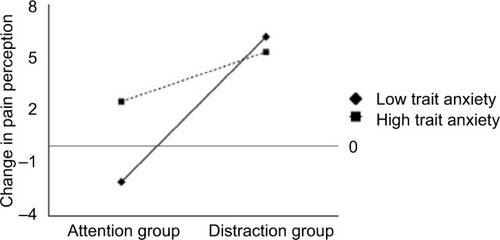
Table 3 Summary of attention model