Figures & data
Table 1 Inclusion and exclusion criteria
Table 2 Baseline demographic and clinical data (n=80)
Figure 1 Primary end point.
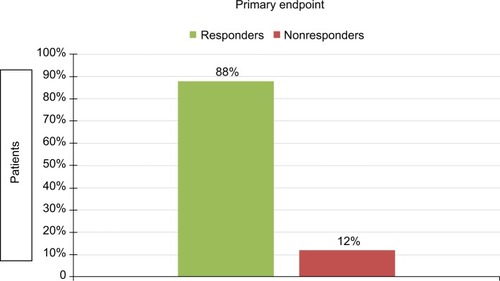
Figure 2 Regression analysis showed that no covariate tested was significant.
Abbreviations: ECOG, Eastern Cooperative Oncology Group; NRS, numeric rating scale.
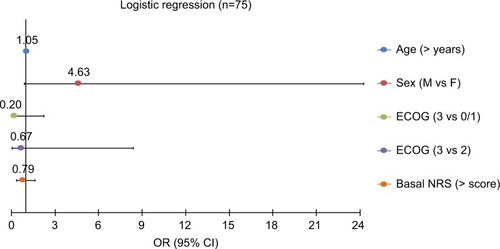
Figure 3 Survival analysis: median time to response 65 days.
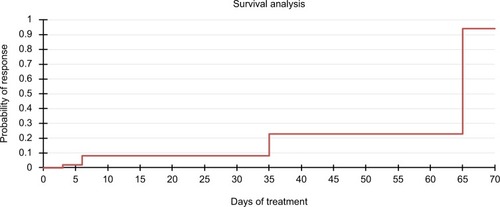
Figure 4 Pain intensity.
Notes: Pain-intensity reductions were statistically significant compared to T0 for all evaluations (*P<0.01).
Abbreviation: NRS, numeric rating scale.
Abbreviation: NRS, numeric rating scale.
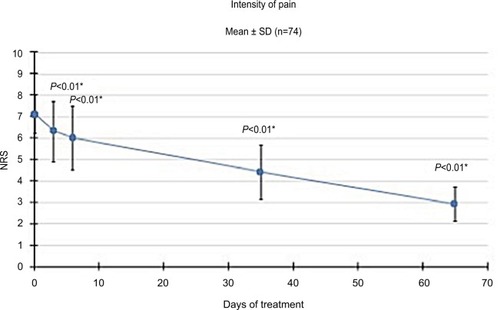
Figure 5 Pain-intensity differences.
Note: During the study, pain-intensity difference progressively increased, although never reached significance.
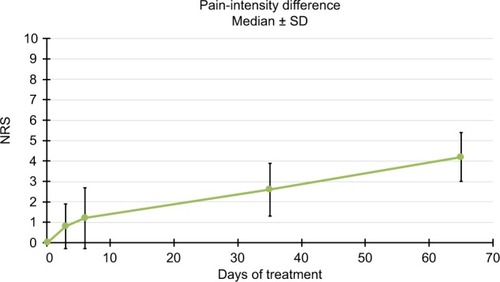
Figure 6 TP-dosage trend.
Note: Mean TP dosage increased in the course of the study. SD: 89.0 (T0), 81.6 (T1), 86.0 (T2), 113.1 (T3), 137.1 (T4).
Abbreviation: TP, tapentadol.
Abbreviation: TP, tapentadol.
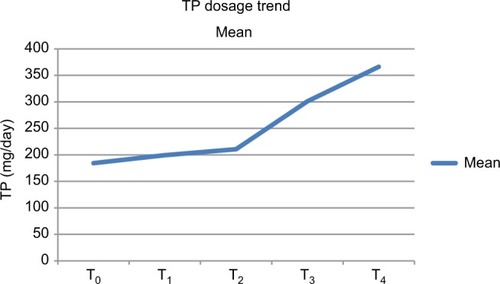
Figure 7 NeP analysis.
Notes: The percentage of patients with NeP progressively decreased during the study. At the last evaluation compared to baseline, the difference was significant (*P<0.01).
Abbreviations: DN, Douleur Neuropathique; NeP, neuropathic pain.
Abbreviations: DN, Douleur Neuropathique; NeP, neuropathic pain.
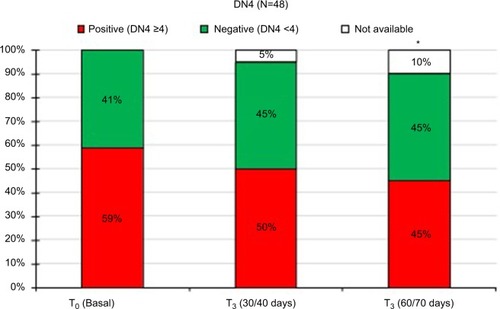
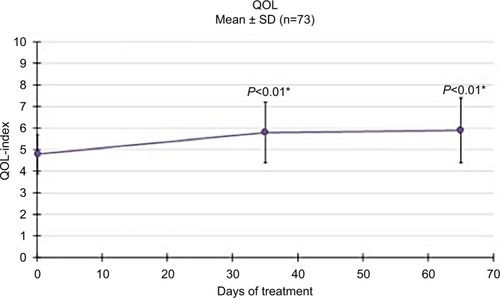
Figure 8 Evaluation of quality of life (QOL).
Note: QOL progressively increased from the beginning of the study (P<0.01).