
Figures & data
Table 1 Patient characteristics
Table 2 Item scores and Mokken-scale analysis
Table 3 Spearman correlations with GPQ total score
Figure 1 ROC curve of the GPQ for classifying patients with FM vs RA.
Abbreviations: FM, fibromyalgia; GPQ, generalized pain questionnaire; RA, rheumatoid arthritis; ROC, receiver-operating characteristic.
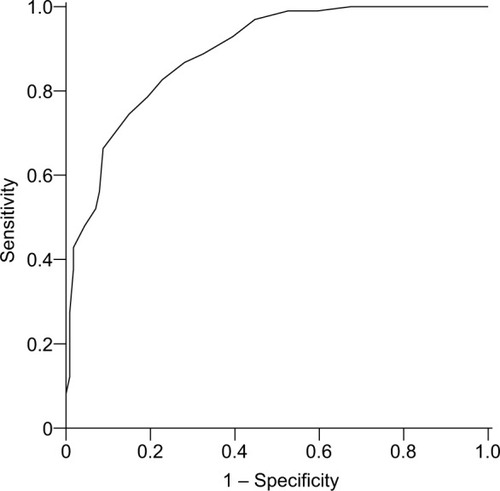
Table 4 Univariate and multivariate associations with FM