Figures & data
Figure 1 Schematic of the experimental process. i.p. stands for injected intraperitoneally; i.t. stands for intrathecally.
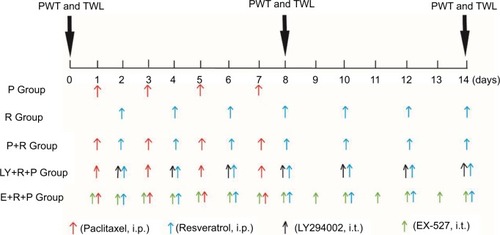
Figure 2 Paclitaxel-induced mechanical and heat hypersensitivity.
Abbreviations: C, control group; R, resveratrol group; P, paclitaxel-treated group; R+P, resveratrol + paclitaxel-treated group: LY, LY294002 group.
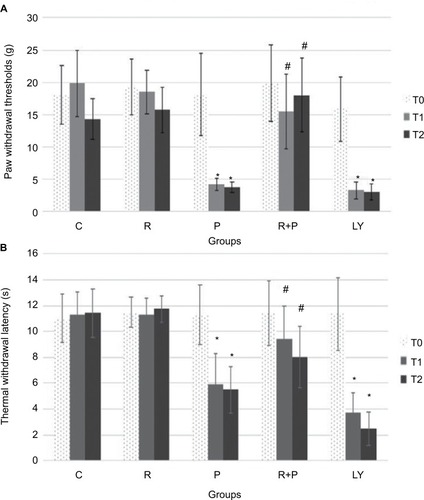
Figure 3 Mitochondrial histomorphology in the corpus striatums of five groups at day 14 by transmission electron microscopy.
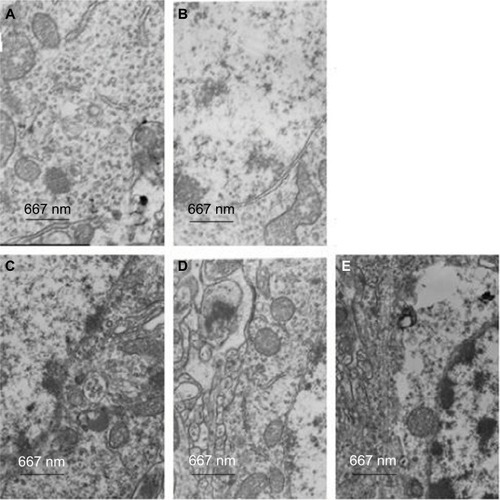
Figure 4 The expressions of p-Akt, PI3K, and t-Akt in five groups (five for each) were detected by immunohistochemistry.
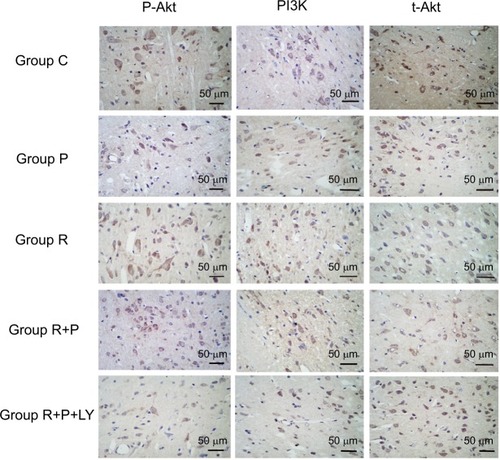
Table 1 The number of positive cells of p-Akt, t-Akt, and PI3K in striatum determined by immunohistochemistry (%, n=5, )
Figure 5 Protein levels of t-Akt and p-Akt in corpus striatum (A-a). Three rats in each group. *P<0.05 compared to control animals, #P<0.05 compared to paclitaxel-treated rats. Protein levels of SIRT1 and PGC1α in corpus striatum (A, B). Protein levels of SIRT1and PGC1α in spinal dorsal horn (B). Protein levels of SIRT1and PGC1α in spinal dorsal horns (C). Protein levels of SIRT1and PGC1α in dorsal root ganglions (D). Paclitaxel reduced the expression levels of SIRT1 and PGC1α (*P<0.05), while resveratrol increased the expression of SIRT1 and PGC1α (*P<0.05); the protein levels of SIRT1 and PGC1α were suppressed by EX527 (*P<0.05).
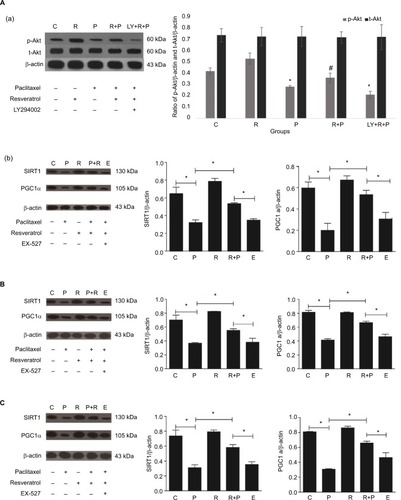
Figure 6 Apoptosis in the corpus striatum, SDH, and DRG of rats with neuralgia induced by paclitaxel.
Abbreviations: C, control group; R, resveratrol group; P, paclitaxel-treated group; R+P, resveratrol + paclitaxel-treated group; DRG, dorsal root ganglions; SDH, spinal dorsal horns; E, pretreated-resveratrol + pretreated-paclitaxel + EX-527 group.
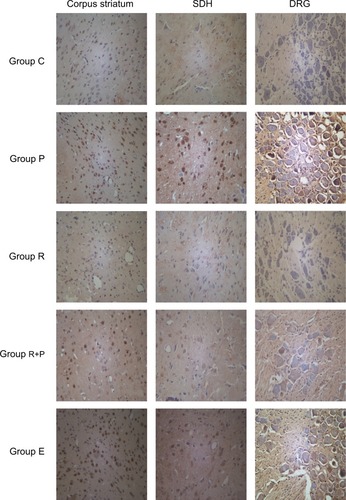
Table 2 The apoptotic rate of corpus striatum, SDH, and DRG
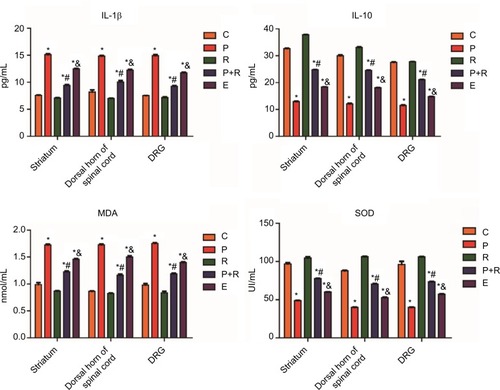
Figure 7 The expression of IL-1β, IL-10, MDA, and SOD in the corpus striatum, SDH, and DRG tissues.
Abbreviations: C, control group; R, resveratrol group; P, paclitaxel-treated group; R+P, resveratrol + paclitaxel-treated group; DRG, dorsal root ganglions; MDA, malondialdehyde; SDH, spinal dorsal horns; SOD, superoxide dismutase.