
Figures & data
Figure 1 Patient disposition.
Abbreviations: THC, Δ9-tetrahydrocannabinol; CBD, cannabidiol; TEAE, treatment-emergent adverse event; Efficacy↓, inadequate analgesic efficacy.
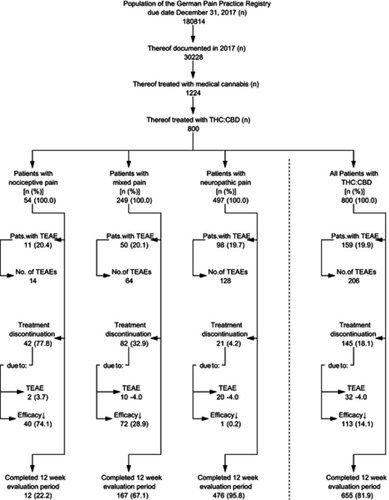
Table 1 Patient demographics
Table 2 Patient baseline characteristics
Figure 2 Exposure to THC:CBD medication. Notes: mean±SD (solid line), median (dashed line in the middle), minimum and maximum (dashed lines at the bottom and top of the grey area) number of sprays per day.
Abbreviations: THC, Δ9-tetrahydrocannabinol; CBD, cannabidiol; BL, baseline; W1–12, observation weeks 1–12.
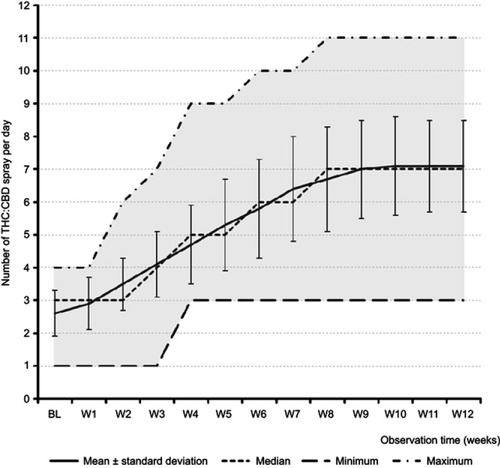
Figure 3 Change of the lowest, average and highest 24-hour pain intensities (mean ±95% CIs) during the 12-week treatment observation with THC:CBD (upper panel). Absolute and relative relief of the 24-hour pain intensity index (PIX) over the 12-week observation time (middle). Percentage of patients with ≥30%, ≥50%, and ≥70% percent improvement of the pain intensity index (PIX) over time (lower panel).
Abbreviations: BL, baseline; W1-W12, weeks 1–12; THC, Δ9-tetrahydrocannabinol; CBD, cannabidiol; PIX, pain intensity index.
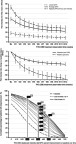
Figure 4 Course of the pain intensity index (PIX) over time for patients with nociceptive, mixed, and neuropathic types of chronic pain (upper panel: absolute change, lower panel: relative change vs baseline).
Abbreviations: BL, baseline; W1-W12, weeks 1–12; THC, Δ9-tetrahydrocannabinol; CBD, cannabidiol.
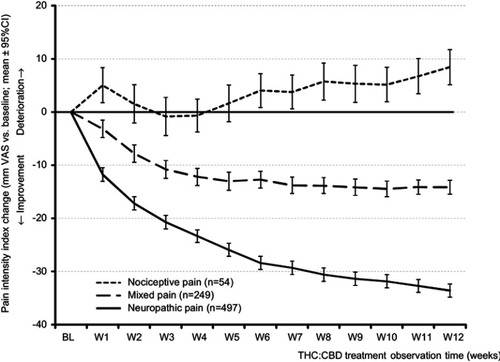
Figure 5 Proportion of patients (percent) with nociceptive (light grey), mixed (grey) and neuropathic pain (black) who reported an individual ≥50 improvement (vs baseline) with respect to pain intensity (PIX), pain-related disabilities in daily life (mPDI), sleep, overall well-being (MQHHF), physical (SF12-PCS) and mental quality-of-life (SF12-MCS), depression (DASS-D), anxiety (DASS-A), and stress (DASS-S) – the nine factors of the aggregated symptom relief score (ASR-9; upper panel). Proportion of patients (percent) who reported a ≥50% improvement vs baseline in 1–9 ASR-9 factors (lower panel).
Abbreviations: THC, Δ9-tetrahydrocannabinol; CBD, cannabidiol; PIX, 24-hour pain intensity index; mPDI, modified pain disability index; MQHHF, Marburg Questionnaire of Habitual Health Findings; SF12PCS, Short Form 12 Physical Component Scale; SF12MCS, Short Form 12 Mental Component Scale; DASS, Depression, Anxiety, Stress Scale; D, depression; A, anxiety; S: stress; ASR, aggregated nine-factor symptom relief score.
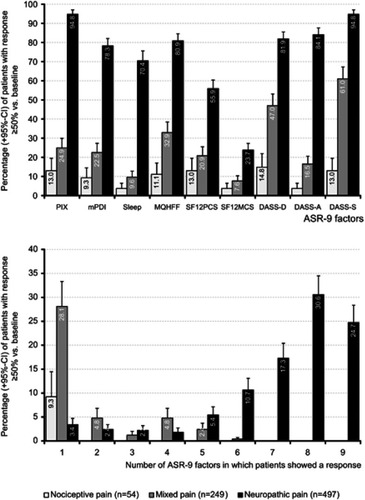
Figure 6 Scatterplot of the number of THC:CBD sprays per day (X-axis) vs the aggregated nine-factor symptom relief score (ASR-9; Y-axis).
Abbreviations: THC, Δ9-tetrahydrocannabinol; CBD, cannabidiol.
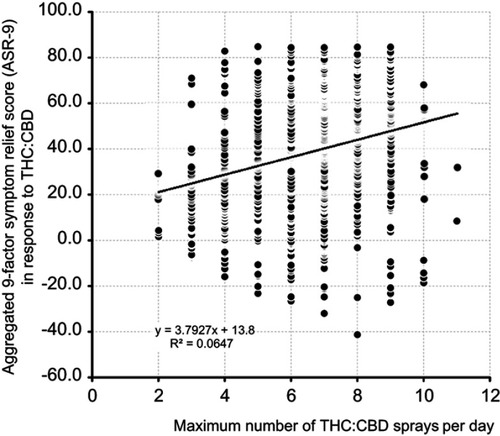
Figure 7 Average change due to THC:CBD at the end of observation week 12 vs baseline with respect to the aggregated nine-factor symptom relief score (ASR-9) for CP patients with nociceptive (light grey), mixed (grey) and neuropathic pain (black).
Abbreviations: THC, Δ9-tetrahydrocannabinol; CBD, cannabidiol; PIX, 24-hr pain intensity index; mPDI, modified pain disability index; MQHHF, Marburg Questionnaire of Habitual Health Findings; SF12PCS, Short Form 12 Physical Component Scale; SF12MCS, Short Form 12 Mental Component Scale; DASS, Depression, Anxiety, Stress Scale; D, depression; A: anxiety; S, stress.
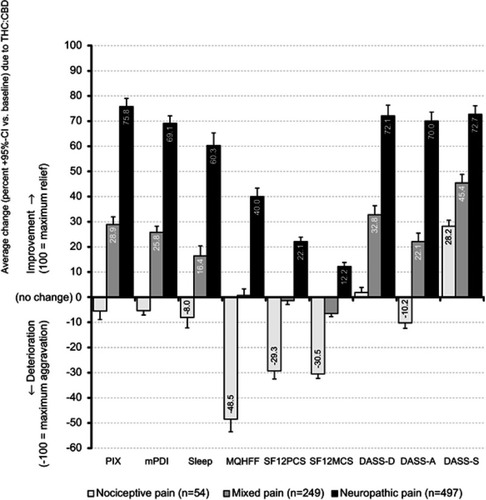
Figure 8 Correlation of the aggregated nine-factor symptom relief score (ASR-9; Y-axis) with the PDQ7 score (X-axis) – a correlate for the involvement of neuropathic pain mechanisms (left panel). Box-(median, 25/75 percentiles; triangles: mean) and-whisker (2.5/97.5 percentile) plots of the ASR-9 symptom relief score for CP patients with nociceptive, mixed and neuropathic phenomenology.
Abbreviations: ASR-9, aggregated nine-factor symptom relief score; THC, Δ9-tetrahydrocannabinol; CBD, cannabidiol; R2, correlation coefficient; PDQ-7, Seven-Dimensional Pain Detect Questionnaire.
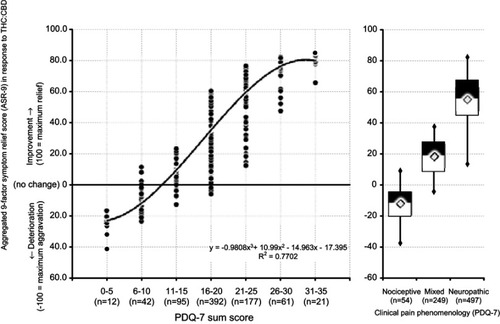
Figure 9 Proportion of patients (percent) on THC:CBD treatment.
Abbreviations: THC, Δ9-tetrahydrocannabinol; CBD, cannabidiol; BL, baseline; W1-W12, weeks 1–12.
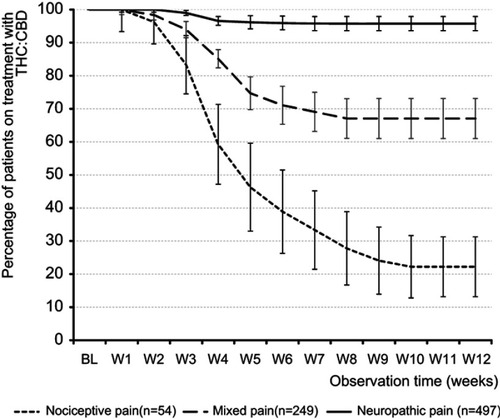
Figure 10 Proportion of patients (percent) with distinct capabilities to relief pain with THC:CBD (upper panel). Overall efficacy rating of THC:CBD (lower panel).
Abbreviations: THC, Δ9-tetrahydrocannabinol; CBD, cannabidiol.
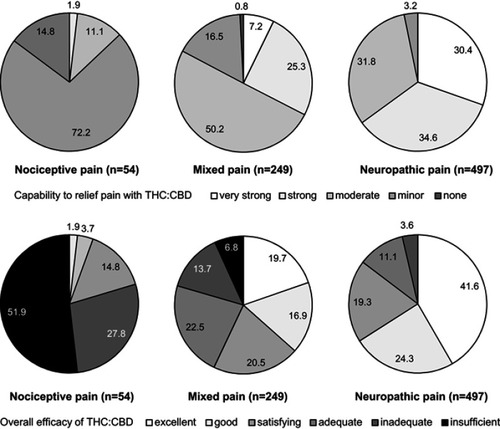
Table 3 Summary of analgesic medications taken at baseline (ie, before) and at the end of the 12-week observation period with THC:CBD
Figure 11 Patient global impression of change (PGIC) ratings for THC:CBD at end of the 12-week observation period.
Abbreviations: THC, Δ9-tetrahydrocannabinol; CBD, cannabidiol.
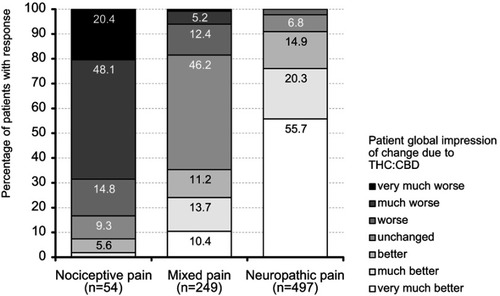
Table 4 Overall treatment-emergent adverse event (TEAE) experience