Figures & data
Figure 1 Study screening flow diagram.
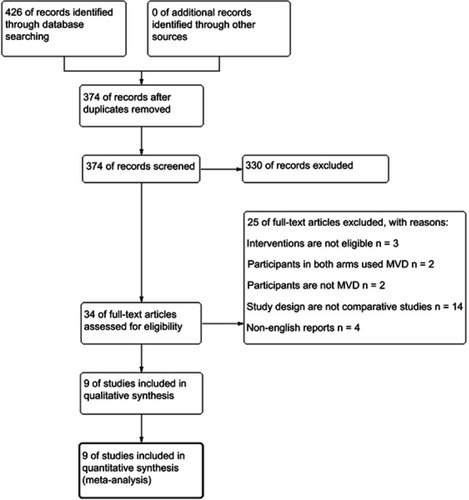
Table 1 Study characteristics
Figure 2 Forest plot of the number of patients requiring additional procedures after surgery.
Abbreviations: MVD, microvascular decompression; RF, radiofrequency thermocoagulation and rhizotomy; RR, risk ratio; CI, confidence interval.
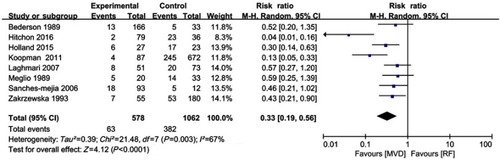
Figure 3 Forest plot of facial numbness.
Abbreviations: MVD, microvascular decompression; RF, radiofrequency thermocoagulation and rhizotomy; RR, risk ratio; CI, confidence interval.
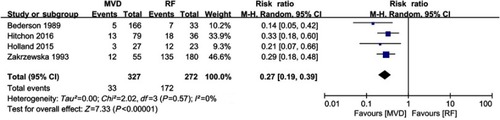
Figure 4 Forest plot of postoperative use of medication.
Abbreviations: MVD, microvascular decompression; RF, radiofrequency thermocoagulation and rhizotomy; RR, risk ratio; CI, confidence interval.
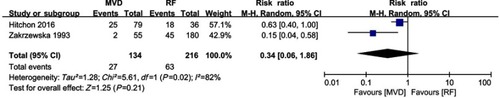
Figure 5 Forest plot of the incidence of any adverse events and specific adverse events.
Abbreviations: MVD, microvascular decompression; RF, radiofrequency thermocoagulation and rhizotomy; RR, risk ratio; CI, confidence interval.
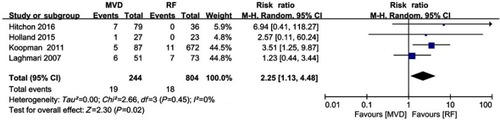
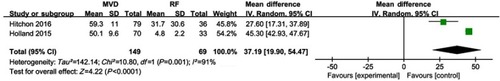
Figure 6 Forest plot of the total cost of intervention.
Abbreviations: MVD, microvascular decompression; RF, radiofrequency thermocoagulation and rhizotomy; RR, risk ratio; CI, confidence interval.