
Figures & data
Figure 1 Schematic showing injection sites for BTX-A. The shading shows the distribution of pain and the filled circles represent BTX-A injection sites. Reproduced from Wu CJ, Lian YJ, Zheng YK, et al, Botulinum toxin type a for the treatment of trigeminal neuralgia: results from a randomized, double-blind, placebo-controlled trial, Cephalalgia (32(6)) pp. 443–450. Copyright © [2012] (SAGE Publications).Citation17
![Figure 1 Schematic showing injection sites for BTX-A. The shading shows the distribution of pain and the filled circles represent BTX-A injection sites. Reproduced from Wu CJ, Lian YJ, Zheng YK, et al, Botulinum toxin type a for the treatment of trigeminal neuralgia: results from a randomized, double-blind, placebo-controlled trial, Cephalalgia (32(6)) pp. 443–450. Copyright © [2012] (SAGE Publications).Citation17](/cms/asset/d0195322-98bf-41cb-b8fe-1370a43509f0/djpr_a_12170169_f0001_c.jpg)
Table 1 The Patient Global Impression of Change (PGIC) Scale
Figure 2 Flow diagram.
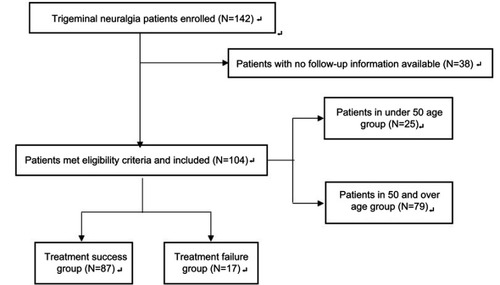
Table 2 Patient demographics
Table 3 Factors of outcomes after BTX-A for trigeminal neuralgia
Figure 3 TN pain outcome after BTX-A in patients under50 compared to patients 50 and over. (A) Patients in the older age group had a significantly greater improvement in average daily pain score following BTX-A treatment. (B) There was a significantly greater proportion of patients in the older age group with PGICscale1-2.
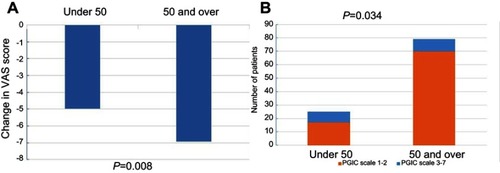
Table 5 Comparison of demographics and outcomes in trigeminal neuralgia patients with <50 years vs ≥50 years
Table 4 Outcomes among different age groups of patients who underwent BTX-A for trigeminal neuralgia